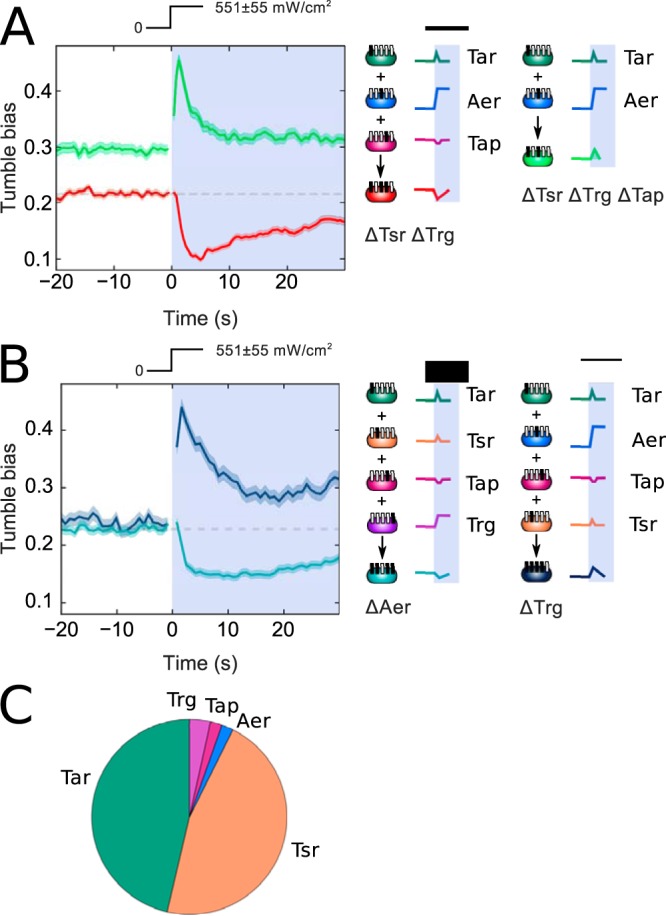
FIG 3.

Effects of receptor composition on the blue light responses in multireceptor strains. (A) Tumble bias traces for ΔTsr ΔTrg (red), and ΔTsr ΔTrg ΔTap (green) strains. (B) Tumble bias traces for ΔTrg (dark blue) and ΔAer (cyan) strains. Schematics show responses observed for individual receptors present in these multireceptor strains. All responses were measured at a blue light intensity of 551 ± 55 mW/cm2, as indicated by the light intensity profile. Approximately 900 to 4,000 trajectories were used to calculate the average tumble bias at each time point. (C) Pie chart of the relative abundances of different receptor types in the wild-type strain, based on data from reference 21.
