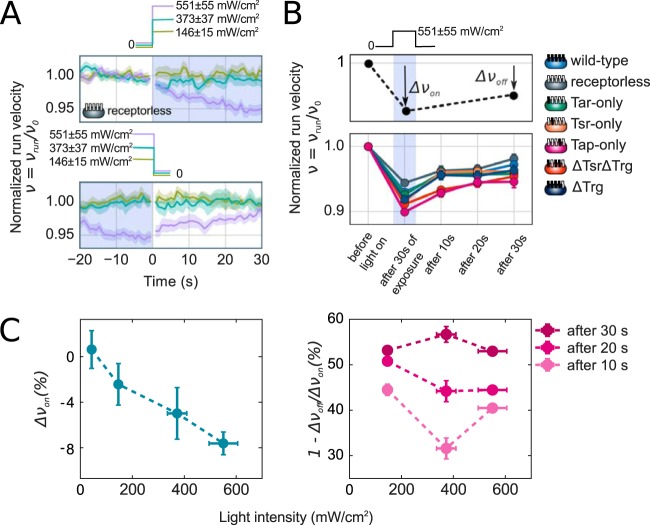
FIG 4.
Effects of light on running velocity. (A) Light exposure causing reversible decreases in swimming velocity. Normalized velocity traces are shown for the receptorless strain UU1250. Approximately 2,000 trajectories were used to calculate velocity at each time point. Light intensity is indicated by the trace color. The velocity is normalized to its prestimulus value (calculated in a 20-s window before light exposure [see Materials and Methods]). (B) Plot of the normalized swimming velocity for different E. coli strains. The normalized velocity was calculated in a 4-s window after 30 s of exposure to light and then 10, 20, and 30 s after the light was turned off. Light exposure and intensity are indicated by the intensity profile above the plot. (C) Dependence of velocity decrease and recovery on light intensity. Velocity decrease (Δνon) and velocity recovery (1 − Δνon/Δνoff) were calculated as illustrated by the schematic in panel B. Velocity recovery is shown 10, 20, and 30 s after light turn off, as indicated by the color.

