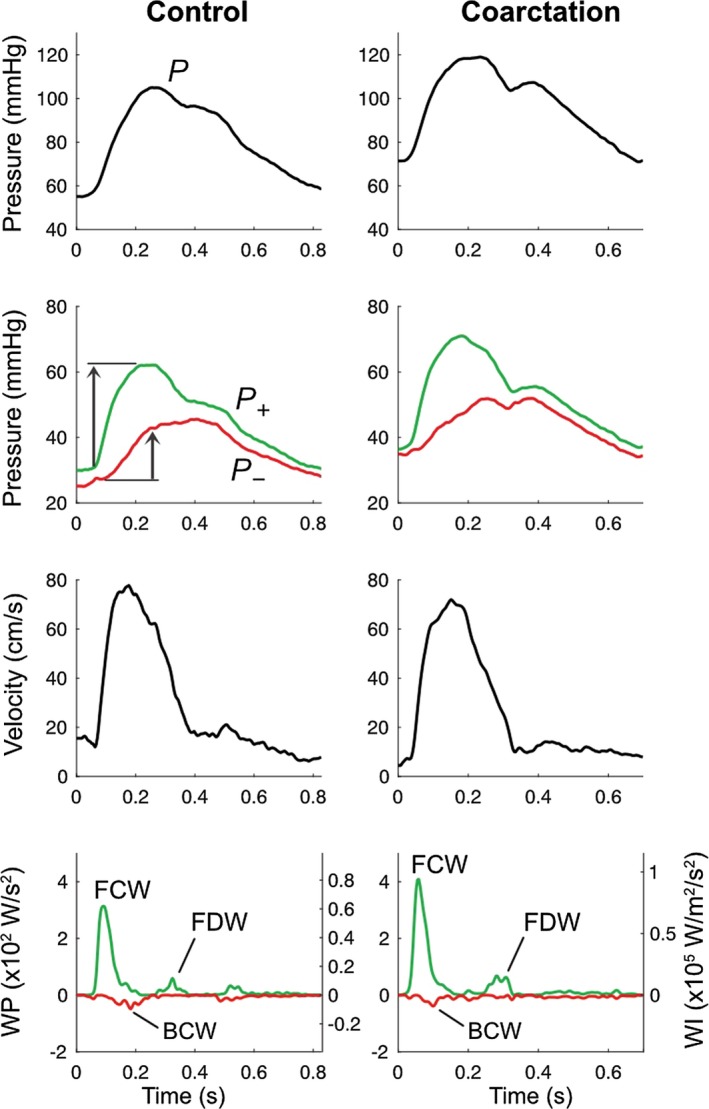
Figure 2.

Example aortic pressure, velocity, wave power (WP) and wave intensity (WI) from control and coarctation participants. Top panel: aortic pressure waveform derived from averaged diameter distention waveforms. Second panel: aortic pressure separated into forward (P+) and backward (P−) components with arrows indicating wave‐related pressure change (ΔP). Third panel: averaged aortic mean velocity waveforms. Lower panel: WP and WI separated into forward (green) and backward (red) components. BCW indicates backward compression wave; FCW, forward compression wave; FDW, forward decompression wave; WI, wave intensity; WP, wave power.
