
Figure 2.
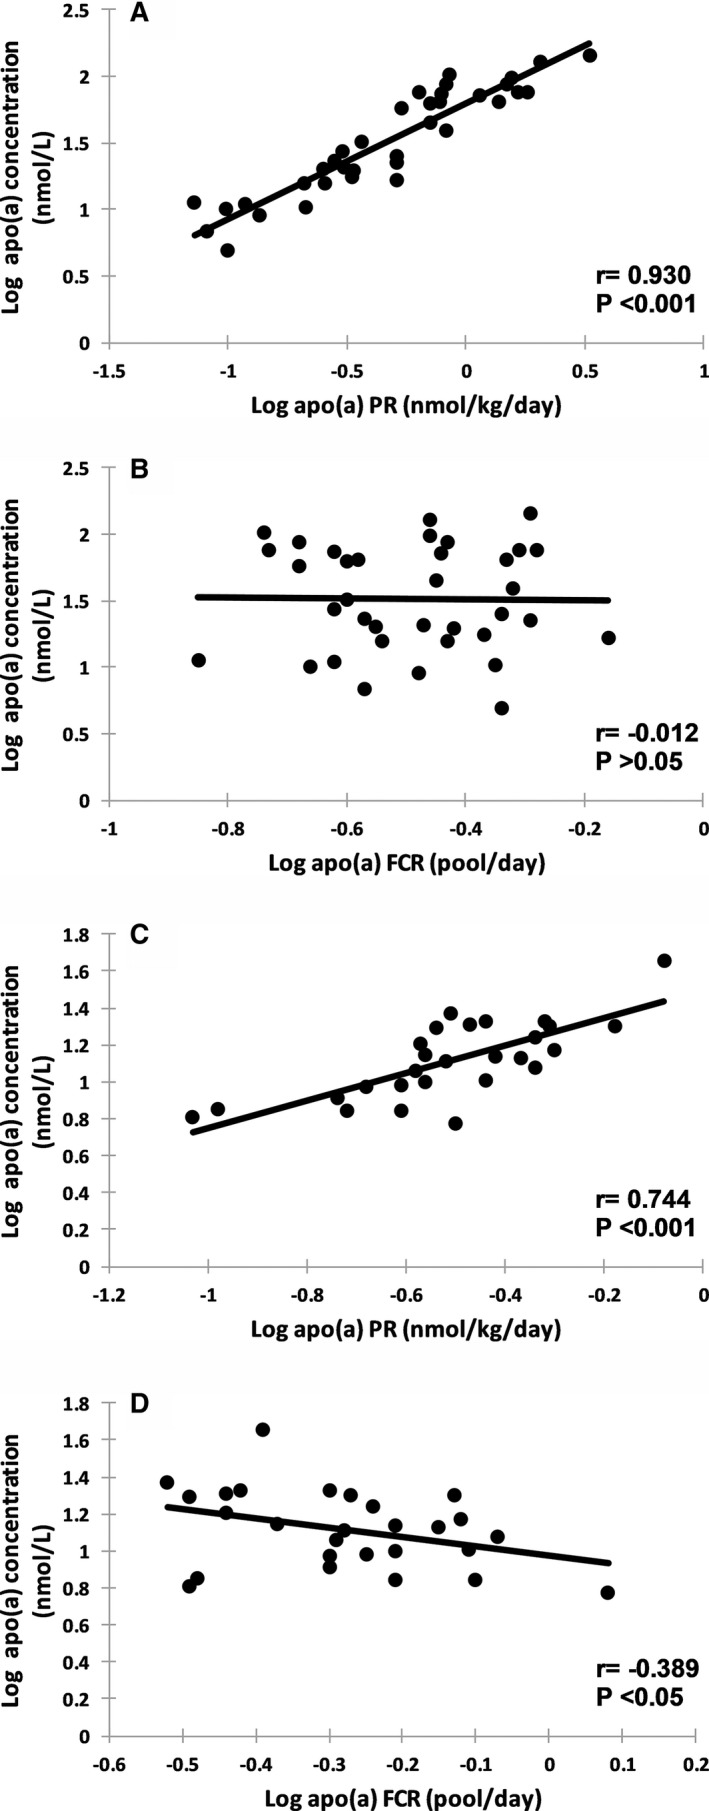
Association between plasma apolipoprotein(a) (apo(a)) concentration and apo(a) production rate (PR) and apo(a) fractional catabolic rate (FCR) at baseline in subjects with smaller apo(a) isoforms ≤22 kringle‐IV (KIV) (n=36, A and B, respectively) and larger apo(a) isoforms >22 KIV (n=27, C and D, respectively).