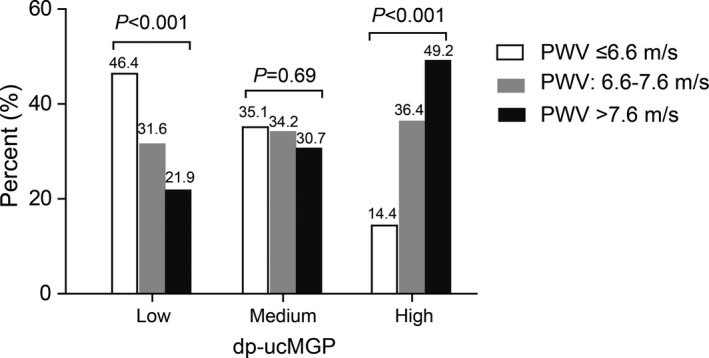
Figure 1.

Prevalence of low, medium, and high pulse wave velocity (PWV; ≤6.6, 6.6–7.6, and >7.6 m/s, respectively) by tertiles of the distribution of desphospho‐uncarboxylated matrix Gla protein (dp‐ucMGP). P values, derived from a χ2 statistic, highlight a decreasing trend of PWV at low dp‐ucMGP, an increasing trend at high dp‐ucMGP, and absence of a trend at medium dp‐ucMGP.
