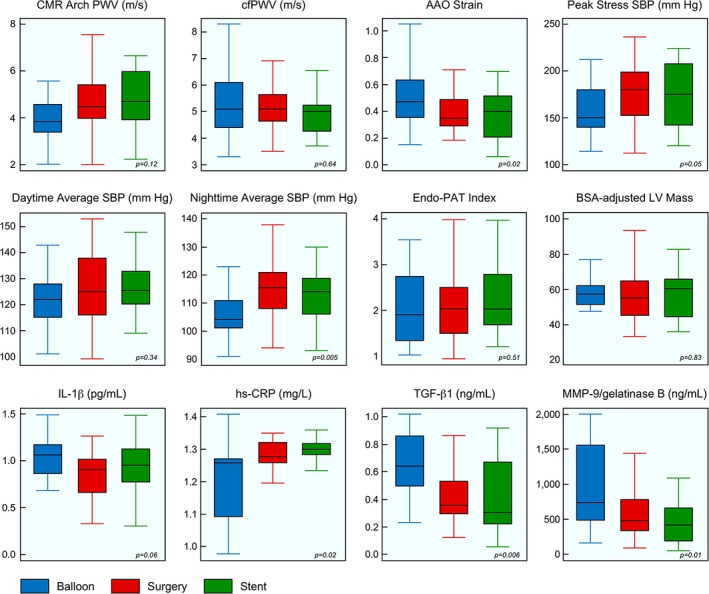
Figure 1.

Comparison of key vascular function parameters between groups. Box and whisker plot of selected study variables. Boxes represent mean±2 SDs, and whiskers represent minimum and maximum values. Blue is balloon dilation; red is surgery; and green is stent. AAO indicates ascending aorta; BSA, body surface area; cfPWV, carotid‐femoral pulse wave velocity; CMR, cardiac magnetic resonance; Endo‐PAT, endothelial pulse amplitude testing; hs‐CRP, high‐sensitivity C‐reactive protein; IL‐1β, interleukin 1 beta; LV, left ventricle; MMP‐9, matrix metalloprotease 9; PWV, pulse wave velocity; SBP, systolic blood pressure; TGF‐β1, transforming growth factor beta‐1.
