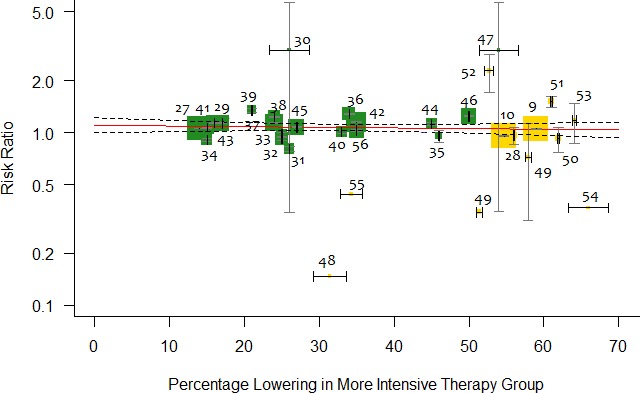
Figure 3.

Metaregression showing association between percentage reduction of LDL (low‐density lipoprotein) cholesterol (LDL‐C) in the active arm and relative risk of incident diabetes mellitus. Each trial is represented by a data marker, the size of which is proportional to the weight in the metaregression. The metaregression slope (predicted risk for degree of LDL‐C reduction) is represented by a red line, and 95% CIs are presented as dashed lines. The horizontal lines through each square represent ±1 SE for the associated absolute change in LDL‐C, and the vertical line through each square represents the 95% CI for relative risk.
