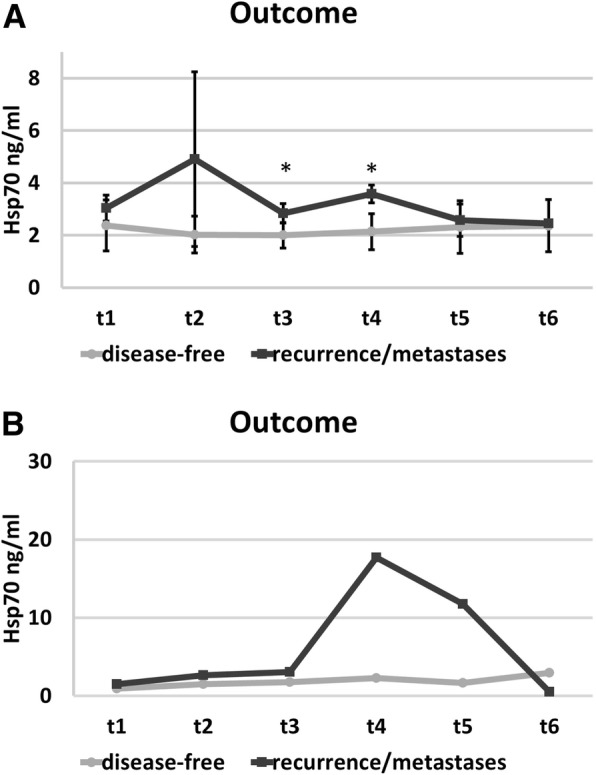
Fig. 2.

Kinetics of free Hsp70 serum concentrations before RT (t1), after 30 Gy during RT (t2), at the end of RT (t3), and in the follow-up period (t4; 6 weeks after RT; t5, 6 months after RT; t6, 1 year after RT) in patients who remained disease-free (closed circles) or patients who developed recurrence or distant metastases (closed squares), as determined by the R&D (a) and lipHsp70 ELISA (b). The values between the two groups differed significantly at t3 (p = 0.03) and t4 (p = 0.007) using R&D ELISA
