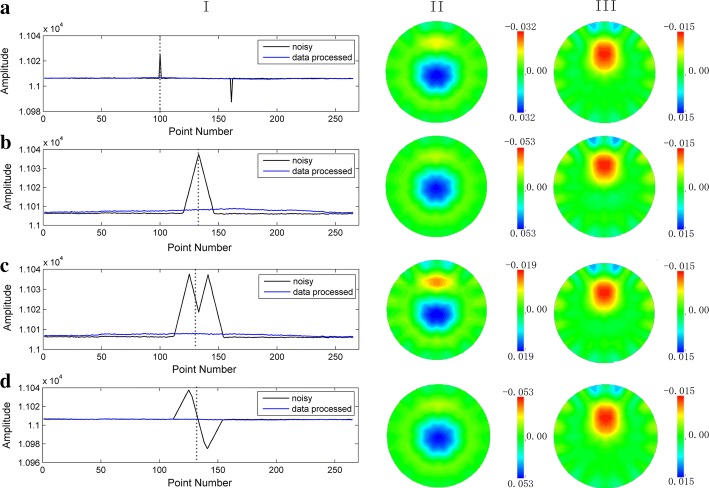
Fig. 7.
Results of wavelet processing experiments on resistor phantom. Rows A–D are four different scenarios of spike interference added in normal data collected on resistor phantom. Column I shows the mean value of data frame before and after processing. Column II presents the EIT images contaminated by added spikes. In Column III is the EIT images reconstructed with processed data by proposed method. In Column I, the dashed lines mark the current frame of the EIT images in Column II and III

