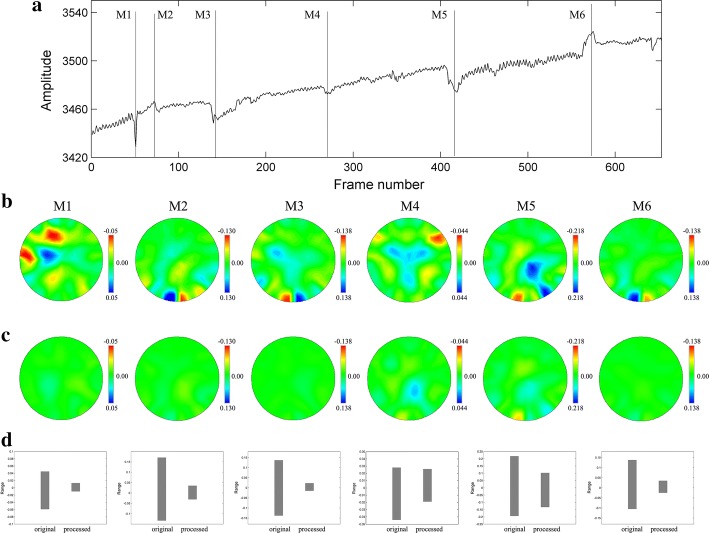
Fig. 9.
Comparison of reconstructed images with the original data and processed data. Row A is the mark of head movement occurrence, M1–M6 is the sequence number of head movement. Row B is the images reconstructed with original data. Row C is the images reconstructed with processed data. Row D is the comparison of reconstruction value range before and after data processing

