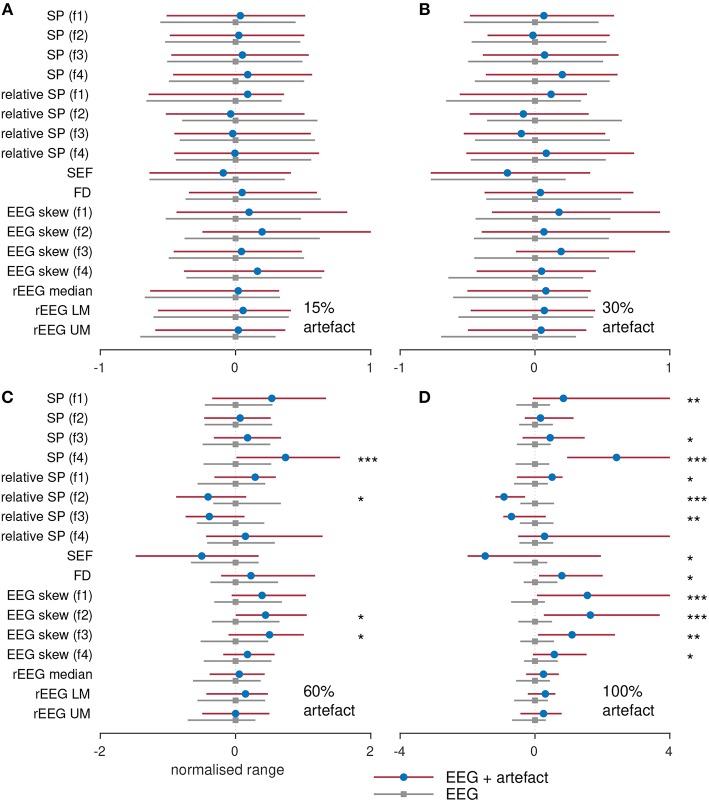
Figure 7.
Comparing features with and without varying degrees of artifact. Features generated from 38 term infants EEG with (A) 15%, (B) 30%, (C) 60%, and (D) 100% artifacts. SP, spectral power; FD, fractal dimension; SEF, spectral edge frequency; rEEG, range-EEG; LM, lower margin; UM, upper margin; Frequency bands: f1, 0.5–4 Hz; f2, 4–7 Hz; f3, 7–13 Hz; and f4, 13–30 Hz. Stars denote statistical significance from Mann–Whitney tests: ***P < 0.001, **P < 0.01, and *P < 0.05 comparing between EEG epochs and EEG epochs with artifacts. Dots represent median values and lines represents inter-quartile range.

