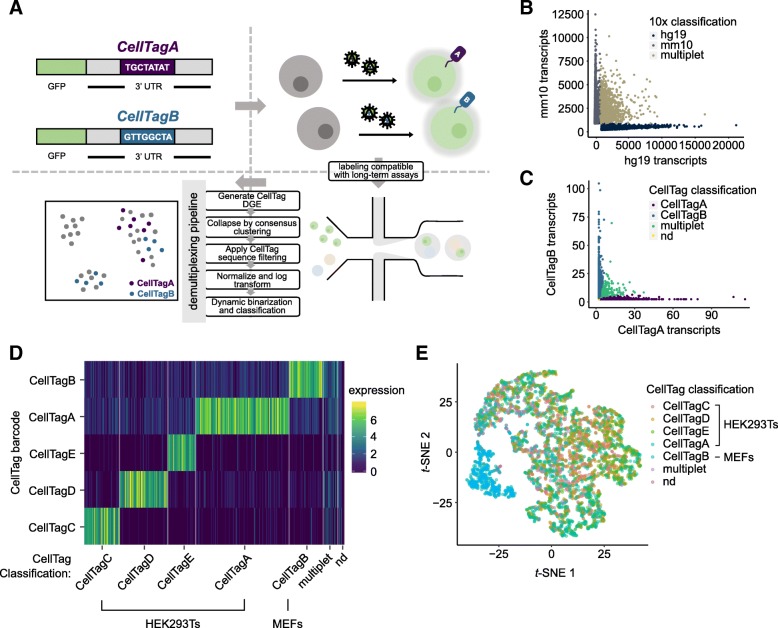
Fig. 1.
Validation of CellTag Indexing for genetic labeling of biological samples. a Schematic of CellTag Indexing. CellTag barcodes are positioned in the 3′ UTR of a lentiviral GFP construct with a SV40 polyadenylation signal. Barcoded viruses produced from CellTag constructs are used to transduce the cells to be “tagged.” Tagged cells can then be pooled for single-cell profiling. Prior to analysis, cell identity is demultiplexed by our classifier pipeline: A CellTag digital gene expression (DGE) matrix is generated by extracting and counting CellTag sequences for each cell; the DGE is then collapsed by consensus clustering of the detected CellTags; after filtering and log normalization, the DGE is processed by dynamic binarization and classification. Classification results can be visualized as metadata overlaying single transcriptomes projected onto reduced dimensions. b Scatter plot of 18,159 transcriptomes from the 2-tag species mixing experiment, classified by 10x Genomics Cell Ranger pipeline into 9357 single human cells, 7456 single mouse cells, and 1346 multiplets based on alignment to the custom hg19-mm10 reference genome. c Scatter plot of 18,159 transcriptomes from the 2-tag species mixing experiment, demultiplexed by CellTag Indexing into 7510 human cells (CellTagA), 6397 mouse cells (CellTagB), 1040 multiplets, and 3212 non-determined cells. d Log-normalized CellTag expression of the 4673 transcriptomes from the 5-tag species mixing experiment, demultiplexed into their respective sample identity on the x-axis; CellTag barcodes, y-axis. e Transcriptomes from the 5-tag species mixing experiment projected onto reduced dimensions by t-SNE, visualized with CellTag classification. CellTagC, CellTagD, CellTagE, and CellTagA label HEK293Ts; CellTagB labels MEFs

