Fig. 2.
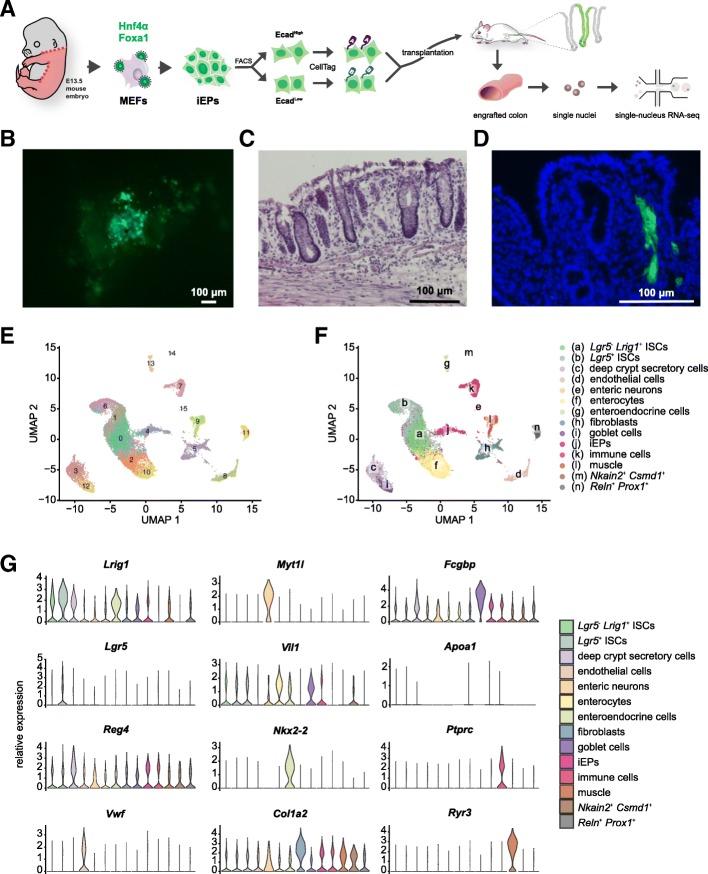
CellTag Indexing for long-term tracking of cells demonstrated in a competitive transplant experiment. A Schematic of iEP generation and enriched into EcadHigh and EcadLow populations by FACS, labeled with CellTagA and CellTagB respectively, pooled in equal proportions and transplanted into a mouse model of colonic injury. Engrafted colon is then processed for single-nucleus RNA-seq. B Fluorescent microscopic images of the lumen of the engrafted colon, showing patches of GFP+ iEPs. Scale bar, 100 μm. C H&E-stained section of the engrafted colon showing normal intestinal architecture with evidence of epithelial injury. Scale bar, 100 μm. D DAPI-stained section of the engrafted colon showing GFP+ iEPs in the mucosa. Scale bar, 100 μm. E Transcriptomes from three post-engraftment colon tissues sequenced and analyzed, visualized by UMAP, revealing 16 clusters. F Annotation of the 16 clusters into (a) Lgr5− Lrig1+ intestinal stem cells (ISCs), (b) Lgr5+ ISCs, (c) deep crypt secretory cells, (d) endothelial cells, (e) enteric neurons, (f) enterocytes, (g) enteroendocrine cells, (h) fibroblasts, (i) goblet cells, (j) iEPs, (k) immune cells, (i) muscle, (m) Nkain2+ Csmd1+ cells, and (n) Reln+ Prox1+ cells. G Marker expression in annotated cell types

