Fig. 3.
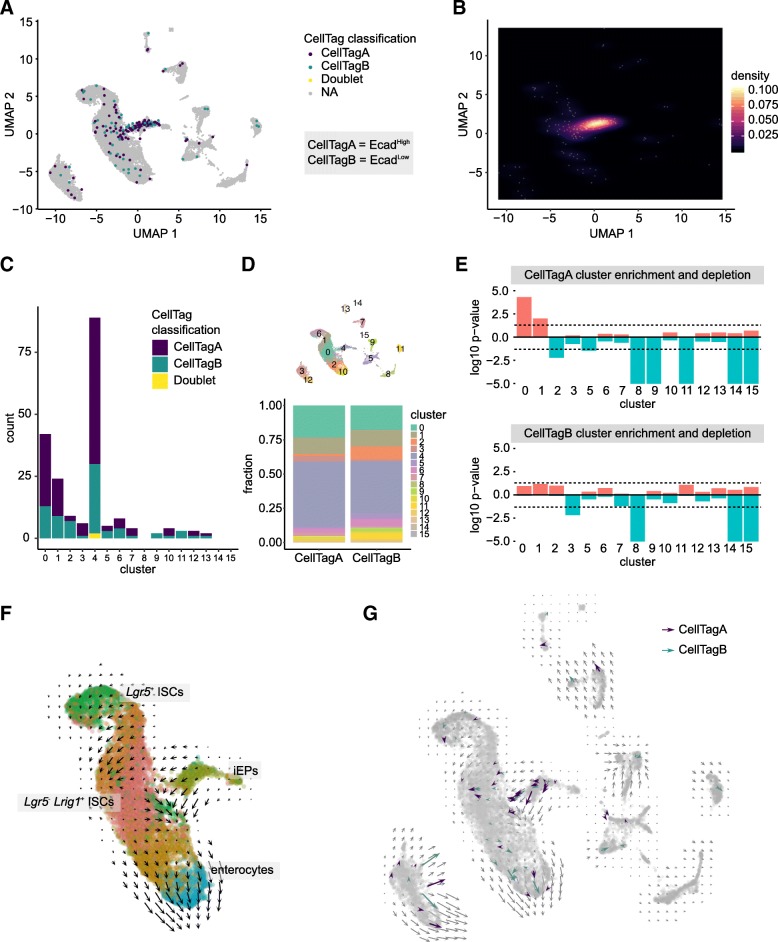
CellTag Indexing revealed iEP engraftment and transition through an intestinal stem cell fate. a CellTags identified engrafted iEPs enriched in cluster 4 (early engraftment iEPs) and the main intestinal epithelial clusters. b Density heatmap confirms enrichment of CellTagged cells in the early engraftment iEP cluster and the main intestinal epithelial cell clusters. c, d Stacked bar plots of CellTagged cells show enrichment in clusters 0, 1, and 4. e Permutation test of cluster enrichment or depletion for each CellTag in intestinal clusters show statistically significant enrichment of EcadHigh/CellTagA cells in cluster 0 (Lgr5− Lrig1+ ISCs, p = 4.03 × 10− 5) and cluster 1 (Lgr5+ ISCs, p = 9.83 × 10− 3). y-axis, negative log10 of p value for cluster enrichment, log10 of p value for cluster depletion. Dotted lines correspond to a p value of 0.05. f RNA velocity analysis shows velocity vectors from iEPs towards Lgr5− Lrig1+ ISCs and from the ISC clusters towards the differentiated enterocyte clusters. g Subset of velocity vectors of CellTagged cells confirm transcriptional kinetics of engrafted iEPs in the direction towards intestinal stem cells

