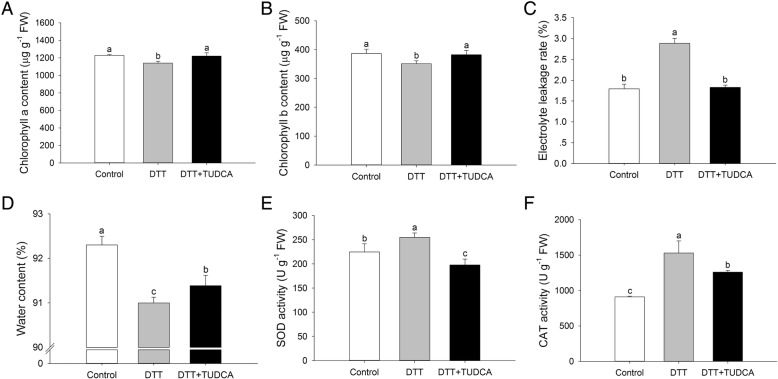
Fig. 2.
Physiological and biochemical changes under different treatments after two days. (a) Chlorophyll a content. (b) Chlorophyll b content. (c) Electrolyte leakage rate. (d) Water content. (e) SOD activity. (f) CAT activity. Different letters indicate significant difference among treatments at the 0.05 significance level based on Duncan’s multiple range tests. Bars represent the mean ± SD (n = 3)

