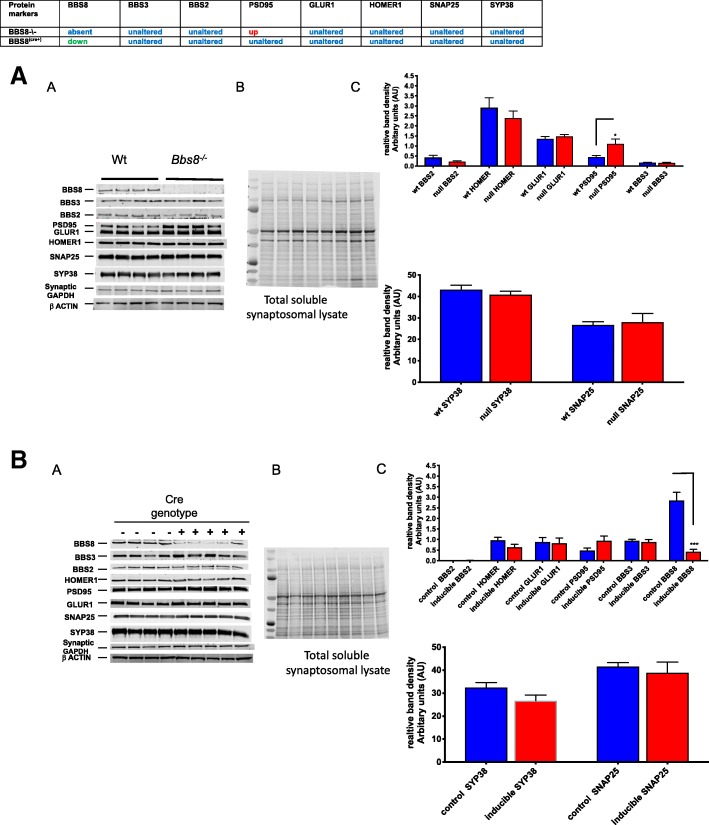
Fig. 15.
Loss of or reduced BBS8 protein levels are associated with increased protein levels of specific postsynaptic density proteins in brains of BBS8 mice. Relative levels of protein changes are summarized and steady state protein levels are shown on the left, in the center a representative image of total protein stain, and on the right graph showing quantitative analysis from western blots of corresponding control mice, Bbs8flox; Cre+, and Bbs8−/− mice total brain synaptosome lysates. Data are presented in the graph as relative mean signal intensity +SEM. a) wt and BBS8-\- mice (n = 4/genotype, *p < 0.043), b) Bbs8flox; Cre- and Bbs8flox; Cre + mice (n > 4/genotype ***p < 0.0004)

