Fig. 1.
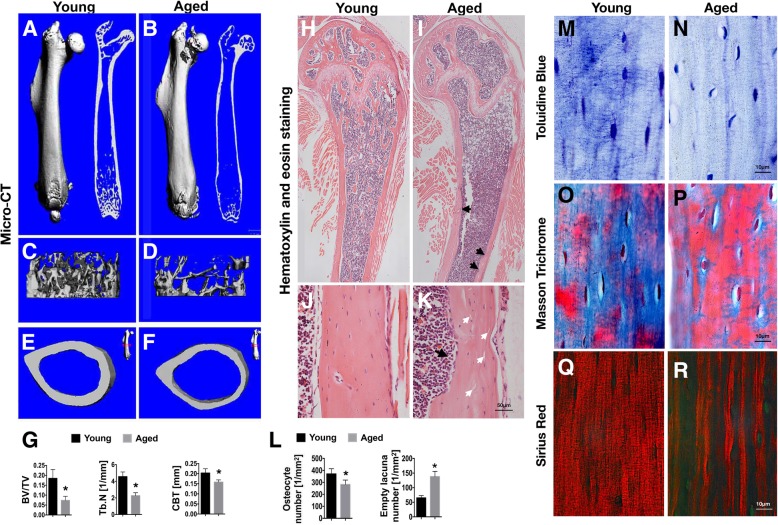
Ageing-related changes of bone and bone matrix. a–f Representative micro CT images: overall views (a, b), trabecular views (c, d), and cross section views (e, f) of young and aged mouse femurs. g Micro CT measurements for bone volume to total volume ratio (BV/TV), trabecular number (Tb.N), and cortical bone thickness (CBT) in mouse femurs. h–k Representative images of H&E staining of mouse femurs: low magnification (h, i) and high magnification of cortical bone area (j, k), young and aged. White arrows (k) indicate the empty lacunae, and black arrows indicate the resorption pits (i, k). l The osteocyte and empty lacuna counts per unit area in the young and aged cortical bone. m, n Representative images of Toluidine Blue staining of cortical bone, young and aged. o–r Distribution of collagen in the bone indicated by Masson’s trichrome (o, p) and Sirius Red staining (q, r), young and aged. Data in all bar plots are shown as means ± SD, *P < 0.05

