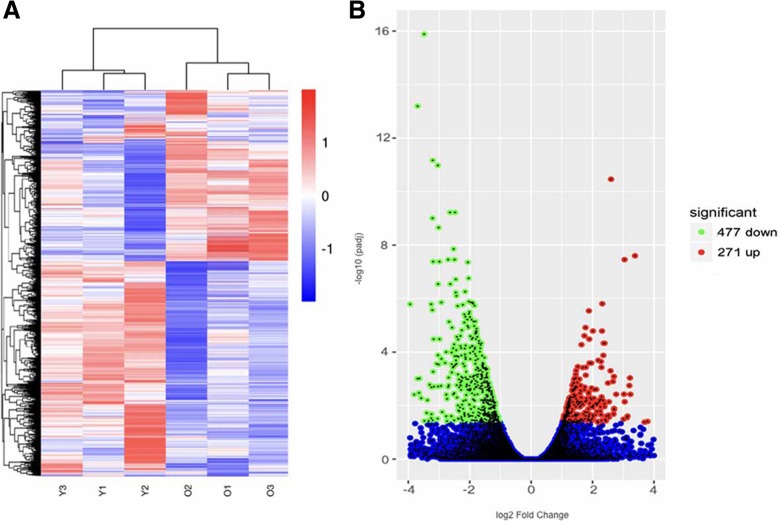
Fig. 3.
Transcriptome analysis of aged and young mouse cortical bone cells by RNA-seq. a Heat map of differential gene expression between the young (Y) and aged (O) groups. b Volcano plots for the differentially expressed genes (DEGs), aged vs young. Numbers are given for the upregulated (red plots) and downregulated (green plots) DEGs

