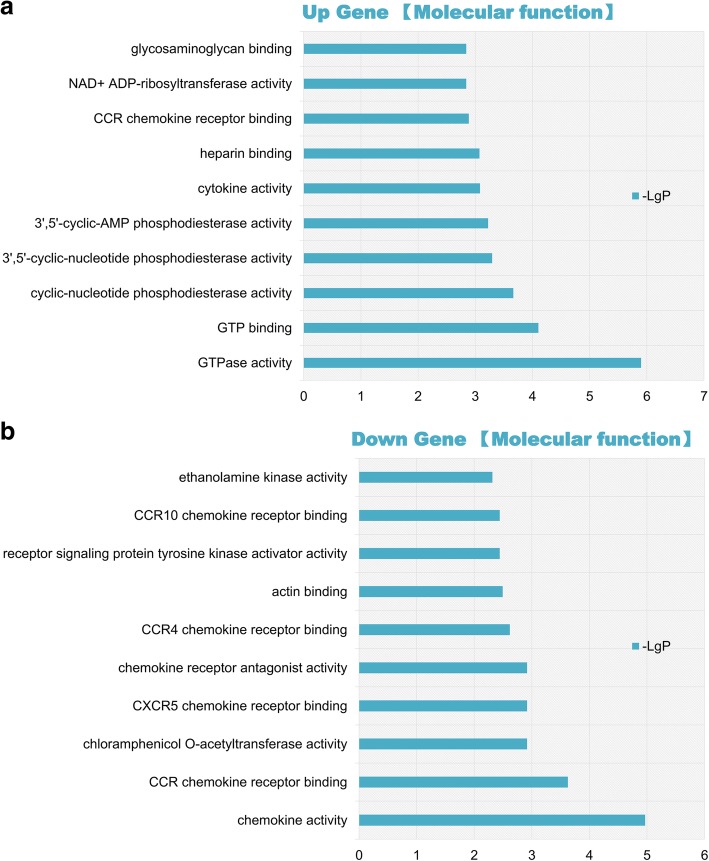
Fig. 4.
GO Enrichment analysis of molecular function. To determine the significant, accurate, targeted gene functions of the target genes, GO enrichment analysis was performed. A group of upregulated genes (a) and downregulated genes (b) associated with molecular functions were shown. The vertical axis indicates the pathway names, while the horizontal axis represents the degree of difference in the probe (−log10 P-value, −LgP)

