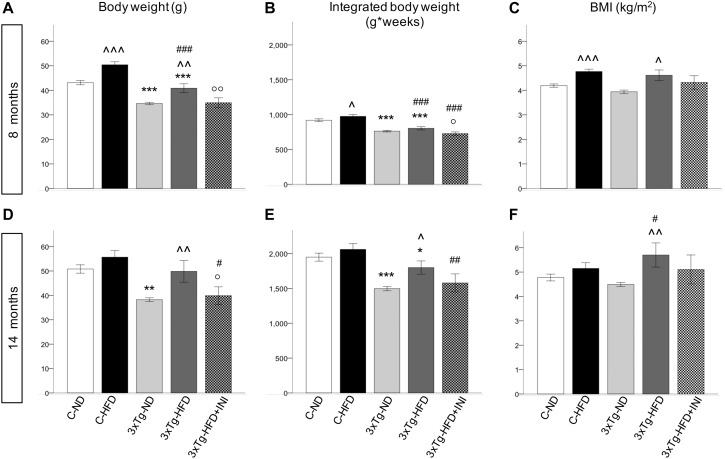
FIGURE 3.
Body weight, areas under the curves and BMI achieved by the study groups at final time-points of 8 (A–C) and 14 months of age (D–F), showing that body weight was affected by diet (positively) and by 3×Tg background (negatively), whereas BMI was only dependent on diet, since 3×Tg mice were lighter, but also shorter (data not shown) than controls. Data are presented as mean ± SEM. Sample sizes are given in Table 1. *p < 0.05 or less (**,***) ND-ND and HFD-HFD (between strains), p < 0.05 or less (,) HFD vs. ND (within-strain), p < 0.05 or less (,) vs. ND control group (reference group), °p < 0.05 or less (°°) for treated 3×Tg-HFD + INI vs. untreated 3×Tg-HFD.

