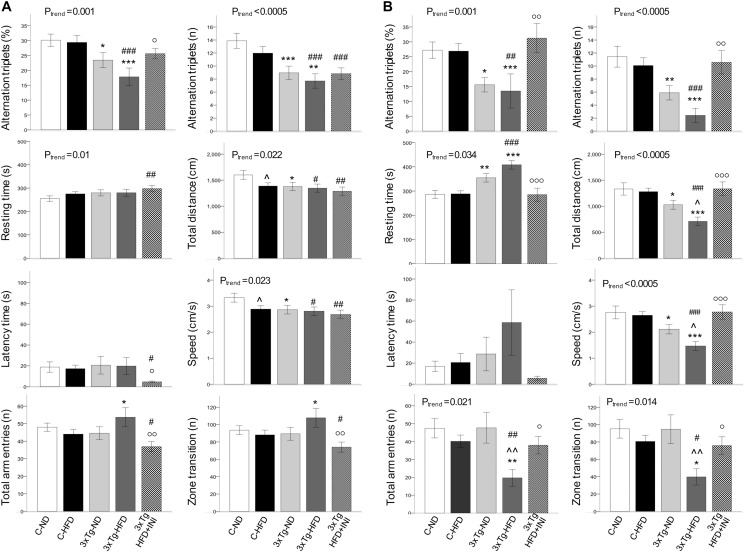
FIGURE 5.
Cognitive function parameters at the age of 8 (A) and 14 months (B). Data are presented as mean ± SEM. Sample sizes are given in Table 1. Ptrend refers to regression analyses across the first four groups. *p < 0.05 or less (**,***) ND-ND and HFD-HFD (between strains), p < 0.05 or less () HFD vs. ND (within-strain), p < 0.05 or less (,) vs. ND control group (reference group), °p < 0.05 or less (°°,°°°) for treated 3×Tg-HFD + INI vs. untreated 3×Tg-HFD.

