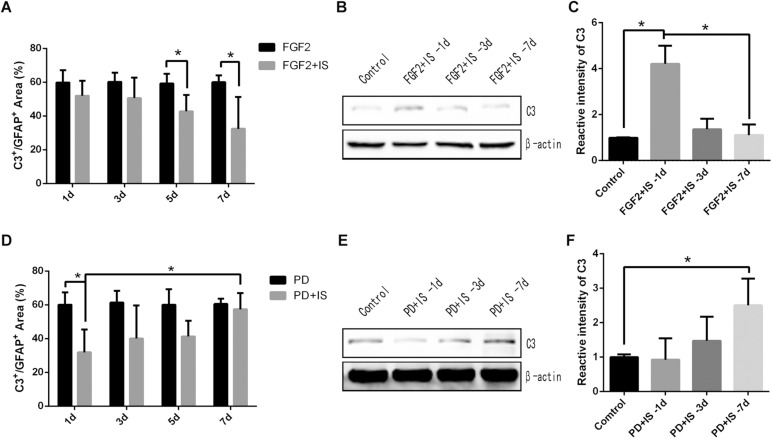
FIGURE 4.
A1 astrocytes were gradually down-regulated by activation of the FGF2/FGFR1 pathway and were up-regulated by inhibition of the FGF2/FGFR1 pathway. (A,D) Quantitative analysis of percentage of C3+/GFAP+ area in the CA1 region of rat hippocampus in different groups, by immunofluorescence staining. (B,E) C3 expression in rat hippocampus in different groups by western blotting. (C,F) Semi-quantitative analysis of C3 expression in rat hippocampus in different groups. N = 6–8 for each experiment. One-way ANOVA. Values expressed as mean ± SD. *P < 0.05.

