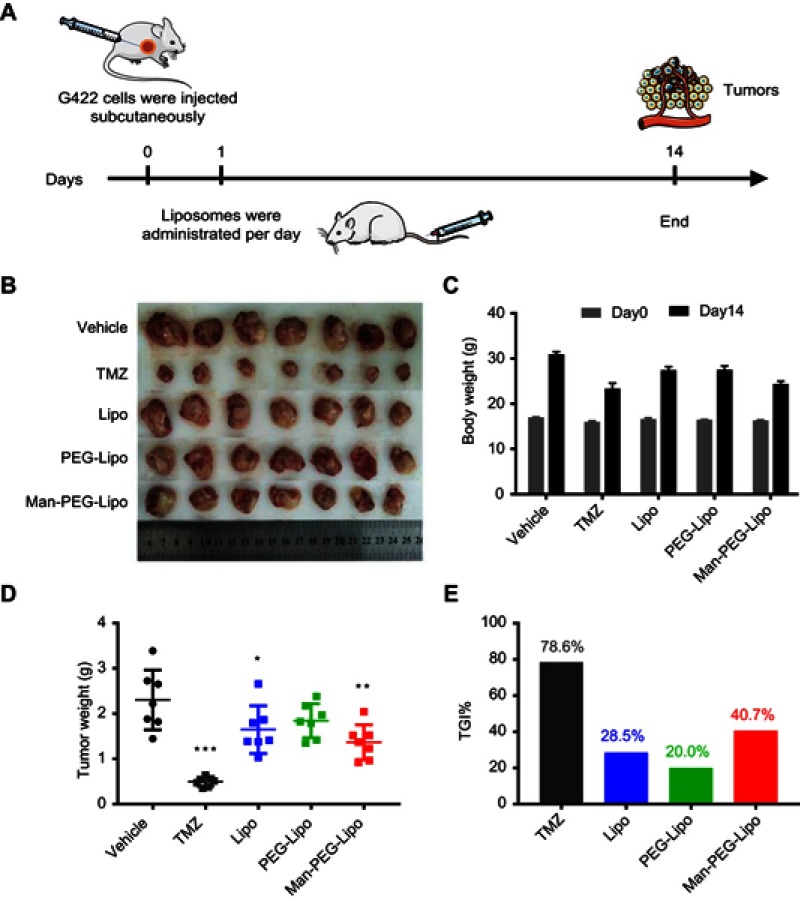
Figure 10.
In vivo antitumor efficacy and safety evaluation of liposomes. (A) The schematic of treatment schedule. The images of excised tumors (B), body weight changes (C), tumor weight (D), and tumor growth inhibition ratio (TGI%) (E) of murine G422 glioma tumor-bearing mice after the intravenous treatment of liposomes. Each value represents the mean ± SD (n=7). *p<0.05, **p<0.01, and ***p<0.001 compared with the vehicle group.
Abbreviations: Lipo, liposomes; PEG-Lipo, PEGylated liposomes; Man-PEG-Lipo, mannosylated liposomes; TGI%, tumor growth inhibition ratio.

