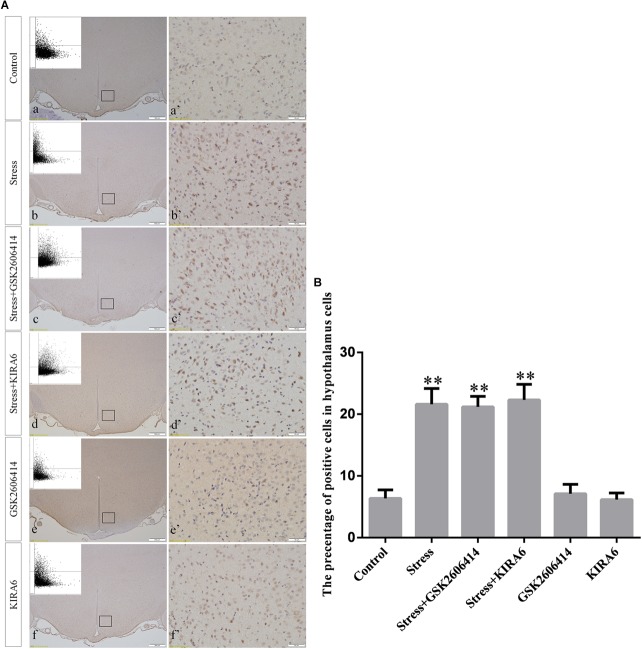
FIGURE 3.
(A) Representative images showing GRP78 immunohistochemistry in the hypothalamus. (a’–f’) are magnified areas of (a–f), respectively. Representative images obtained by microscopy-based multicolor tissue cytometry (MMTC) are shown in the left corners of (a–f). Bars = 500 μm in (a–f); Bars = 50 μm in (a’–f’). (B) Quantitative MMTC analysis. The data are shown as the mean ± SEM, ∗∗P < 0.01 vs. control group (n = 6).

