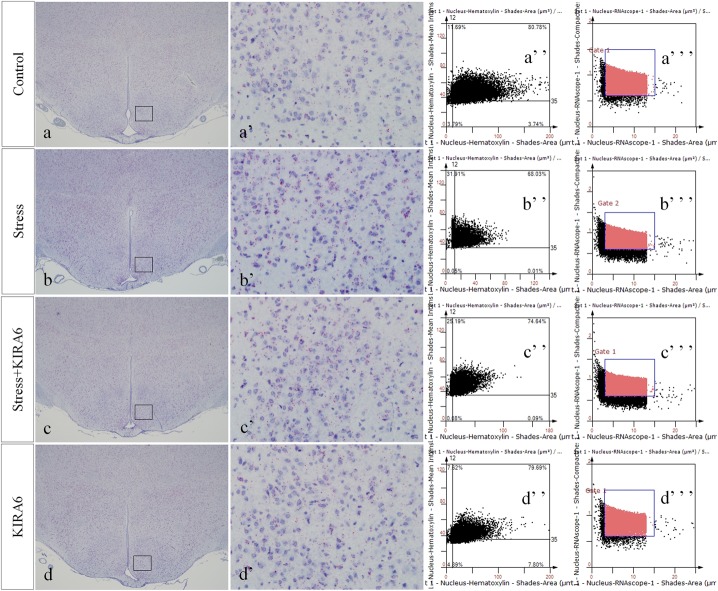
FIGURE 9.
Representative images showing JNK RNAScope in the hypothalamus. (a’–d’) are magnified areas of (a–d), respectively. (a”–d”) and (a”’–d”’) are representative images obtained by MMTC. (a”–d”) show the number of neurons and (a”’–d”’) show the number of RNAScope positive points in the hypothalamus. Bars = 500 μm in (a–d); Bars = 50 μm in (a’–d’).

