FIGURE 6.
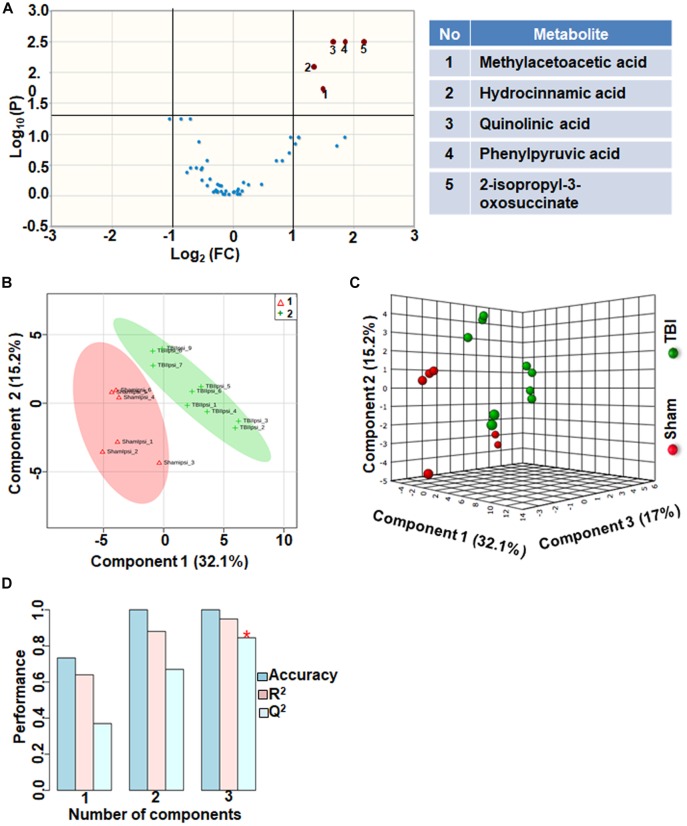
Amino acid metabolism 72 h after TBI in the developing brain. (A) Volcano plot showing FC on x-axis and FDR-adjusted P-values on y-axis. Black vertical and horizontal lines reflect the filtering criteria (FC = 1.0 and FDR corrected P-value < 0.05). Green or red dots represent metabolites that are significantly increased or decreased after TBI, respectively. 10% of the metabolites showed a significant change between sham and TBI. Table on right shows metabolites that are significantly different as denoted by respective numbers in the figure on the left panel. (B,C) PLS-DA analysis of the amino acid metabolite subgroup showing distinct class separation between sham and TBI. (D) PLS-DA model validation analysis and the predictive accuracy indicate high accuracy of Q2 = 0.36, 0.67 and 0.84 for the three components, respectively.

