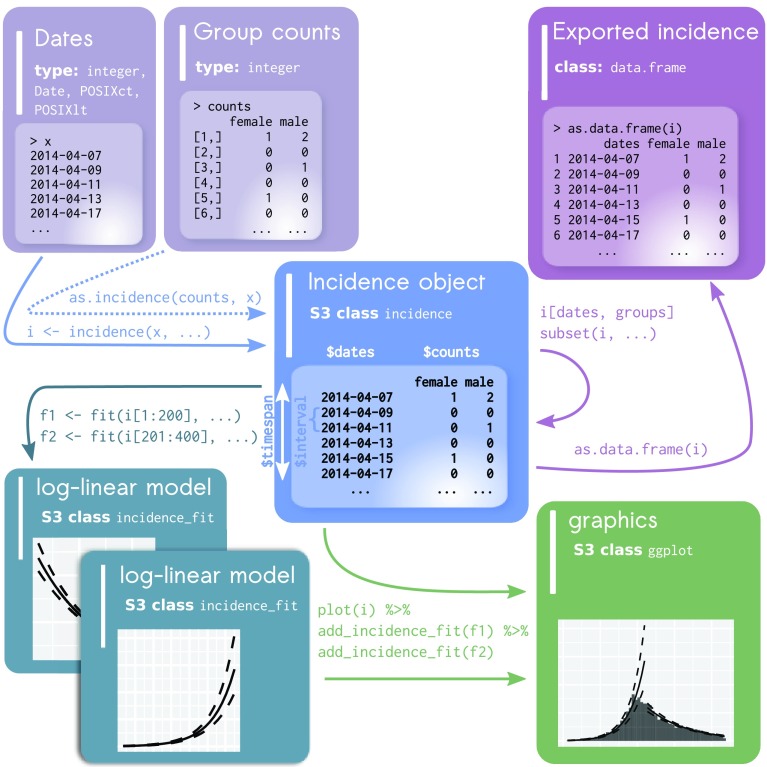
Figure 1. Generalized workflow from incidence object construction to modeling and visualization.
The raw data is depicted in the top left as either a vector of dates for each individual case (typical usage) or a combination of both dates and a matrix of group counts. The incidence object is created from these where it checks and validates the timespan and interval between dates. Data subsetting and export is depicted in the upper right. Data visualization is depicted in the lower right. Addition of log-linear models is depicted in the lower left.

