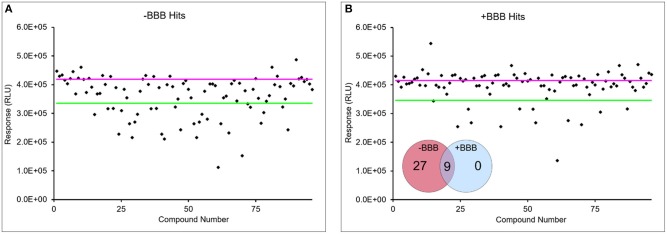
Figure 6.
BBB narrows list of cytotoxic hits in small library screen. Representative LN-229 viability data with (B) and without BBB model (A) from screen of 80-drug library. Pink line is average buffer response and green line represents 3 σ below buffer response. Data points below green line were considered hits. Hits were considered if they were 3 σ below buffer response in at least two out of three independent screens. A fraction of hits in the absence of BBB were identified in the presence of BBB from three screens (inset).

