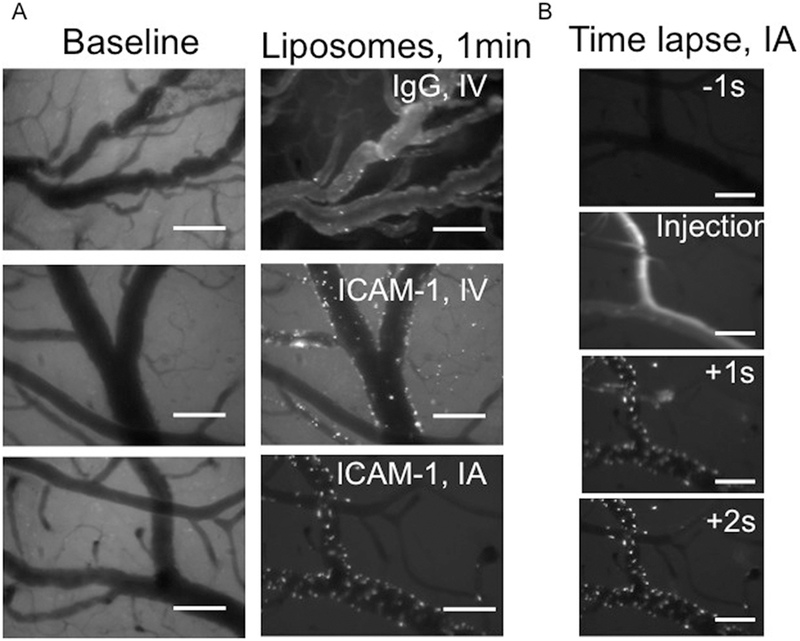
Figure 7. Intravital imaging of anti-ICAM-1/liposomes targeting the inflamed brain.
Intravital microscopy demonstrates real-time vascular localization of fluorescent liposomes. Figure A: Left images show the baseline of the vessel before injury and before administration of liposomes. Right images show the same vessels 2 hours after TNFα injury and 1 minute after injection of immunoliposomes, demonstrating that ICAM-1-targeted NC accumulate in the inflamed vessels immediately after injection (middle and right images) vs. IgG control (top right image) and that IA administration increases the ICAM.1-targeted liposome binding (bottom right). Note that the ICAM-1-targeted liposomes for IV vs. IA administration are from the same preparation. Figure B shows the time course of liposome binding during the first pass. Scale bar: 100 μm.

