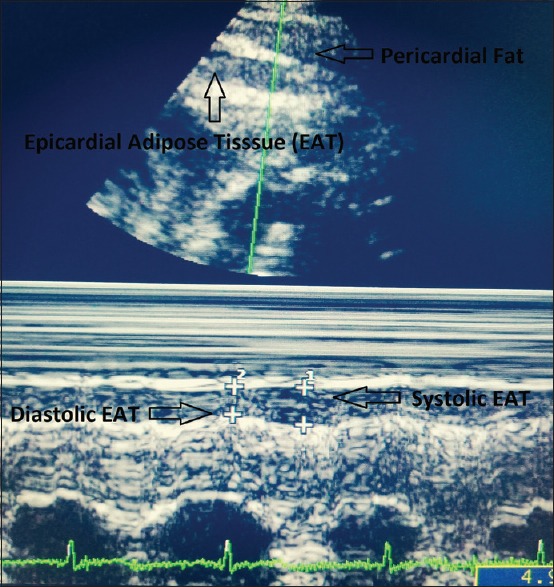
Figure 3.

M-mode Echocardiogram in parasternal long axis view with increased depth setting. Epicardial adipose tissue (EAT) is identified as the hypoechoic area between the epicardial surface and parietal pericardium. It should be differentiated from the adjacent pericardial fat. M-mode is taken at the point of maximum thickness of EAT perpendicular to the right ventricular wall and parallel to the aortic annulus. Diastolic EAT is measured at peak of R wave in ECG and systolic EAT is measured at end of T wave. Diastolic EAT is inherently smaller than systolic EAT
