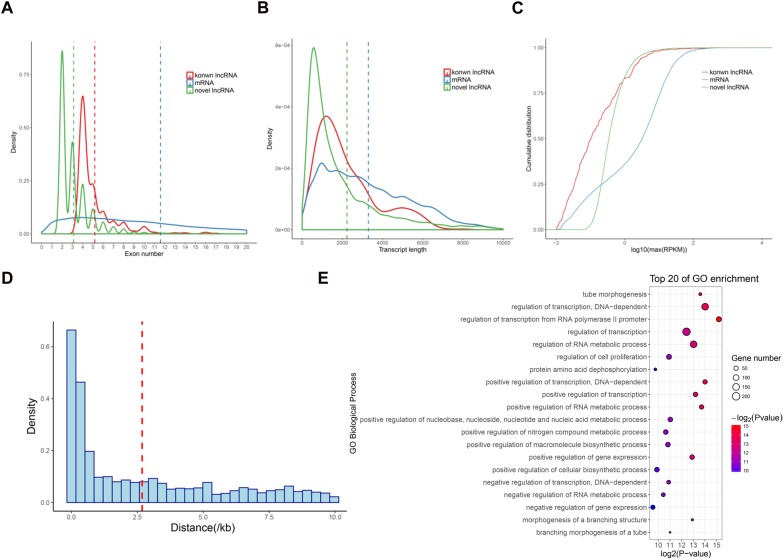
FIGURE 2.
Characterization of lncRNAs in pig pineal glands. (A) Comparison of exon number between lncRNAs and mRNAs. (B) Comparison of transcript length between lncRNAs and mRNAs. (C) Comparison of expression level between lncRNAs and mRNAs. (D) The distribution of the distance from lincRNAs to their nearest neighboring protein-coding genes. The average (red dashed line) distance is indicated. (E) GO biological processes analysis of the neighboring protein-coding genes of the lincRNAs.

