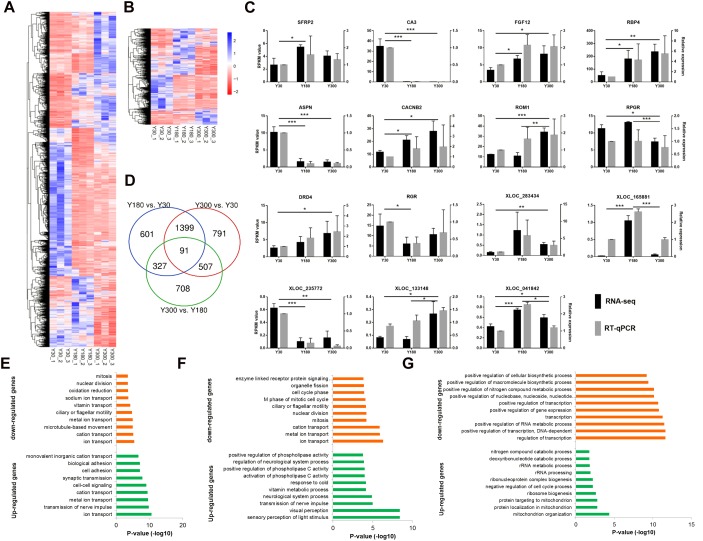
FIGURE 4.
Differential expression analysis of mRNAs and lncRNAs during porcine postnatal pineal development. (A,B) Heatmap showing the differentially expressed mRNAs (A) and lncRNAs (B) during porcine postnatal pineal development. (C) Experimental validation of RNA-seq data by RT-qPCR. Gene expression differences between developmental stages were evaluated based on the RNA-Seq data using the edgeR package. Error bars are SEM, n = 3. ∗P < 0.05, ∗∗P < 0.01, ∗∗∗P < 0.001. (D) Venn diagram showing the number of differentially expressed mRNAs and lncRNAs between different development stages. (E–G) GO biological process analysis of the up-regulated and down-regulated genes between Y180-Y30 (E), Y300-Y30 (F), and Y300-Y180 (G).

