Figure 3.

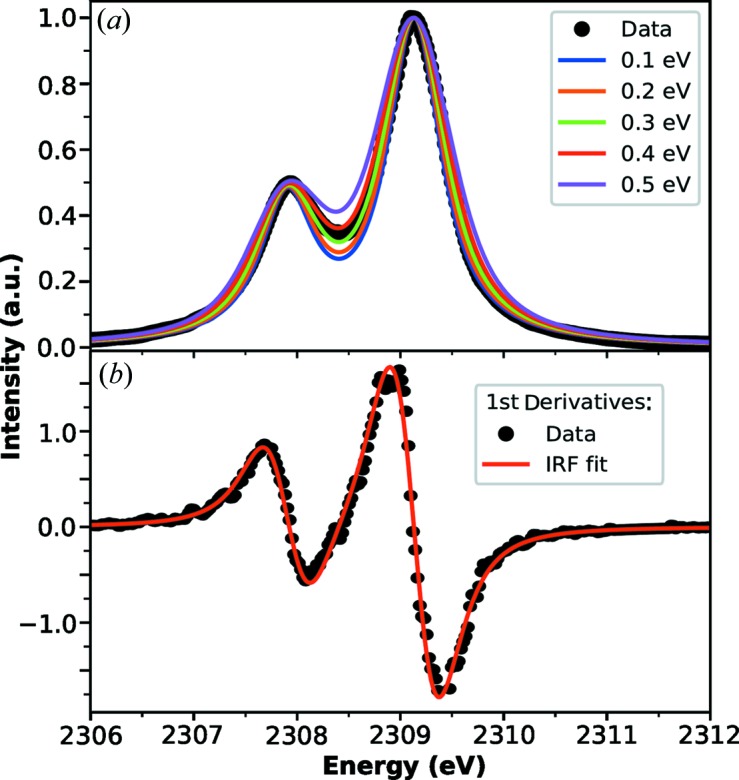
(a) Comparison of the measured sulfur Kα spectrum using the lithium niobate von Hamos analyzer with spectra calculated by convolution of the natural Lorentzian lineshapes with Gaussian functions of varying widths to simulate the instrument response function. Best fit is obtained from a width of 0.29 eV. (b) Derivatives of the measured and best-fit simulated spectra show good agreement between their line shapes.
