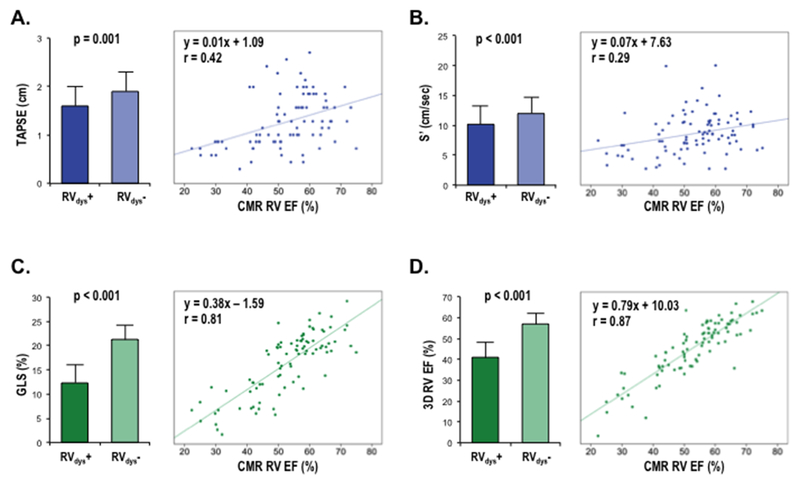
Figure 3. Echo Functional Indices in Relation to CMR-Evidenced RV Dysfunction.

Echo-quantified RV functional indices (mean ± standard deviation) stratified by CMR-quantified RVDYS (RVEF<50%) (left) as well as corresponding correlations of echo indices vs. CMR RVEF (right). Data shown for TAPSE (A), S’ (B), GLS (C), and 3D echo (D).
