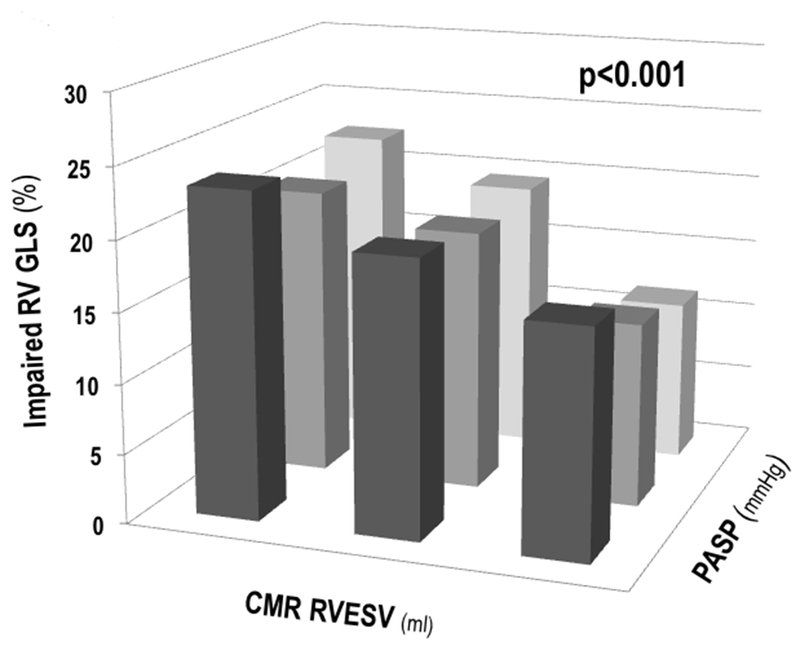
Figure 5. RV Global Longitudinal Strain in Relation to Wall Stress Determinants.

Impaired RV GLS (y-axis) among groups partitioned by population-based tertiles of RV end-systolic volume (x-axis) and PA systolic pressure (z-axis). As shown, impaired GLS was primarily driven by increases in RV end-systolic volume across all three strata of PA systolic pressure.
