Figure 1.

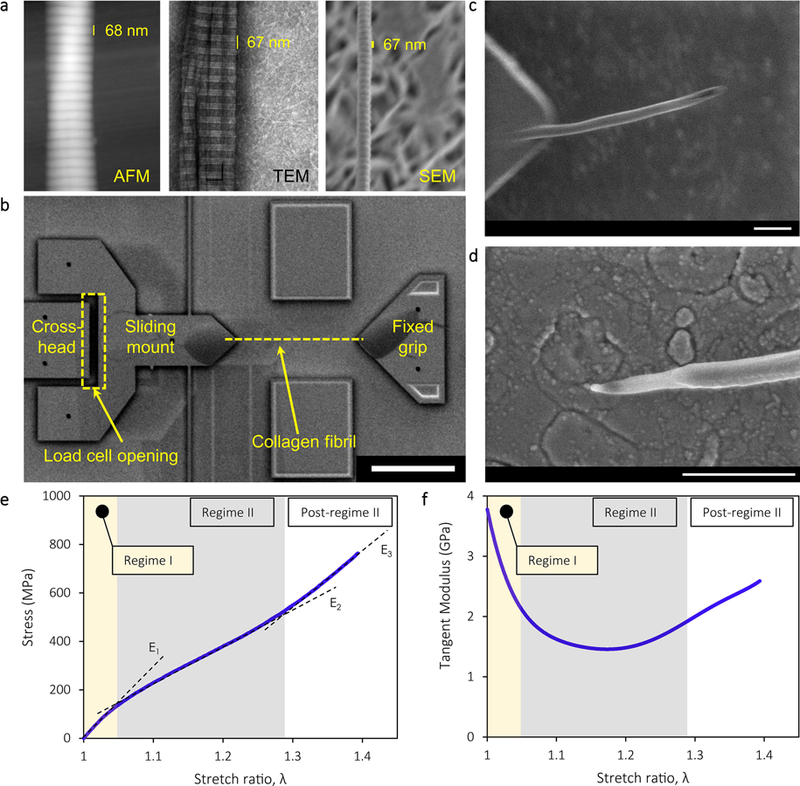
a. Reconstituted mammalian collagen fibrils with D-banding of ~67 nm as imaged by SEM, TEM, and AFM (in air). b. The collagen fibrils were tested under cyclic tension using a MEMS device. Each fibril was bonded between a sliding mount and a fixed grip as shown. The load cell opening, marked by the dashed rectangle, changes proportionally to the force applied to the fibril. MEMS device is shown after test is completed. The scale bar corresponds to 50 μm. c,d. Matching segments of a collagen fibril demonstrating shear failure. The scale bars correspond to 500 nm. e. Stress vs. stretch ratio curve, and f. local slope of stress vs. stretch ratio curve (tangent loading modulus) of a typical fibril, divided into: (I) an initial linear regime (regime I) with modulus E1, (II) a softening regime (regime II) with modulus E2, and (III) a final hardening regime (post-regime II) in which the modulus E3 did not exceed E1. For the curve shown, the fibril diameter was 90 nm.
