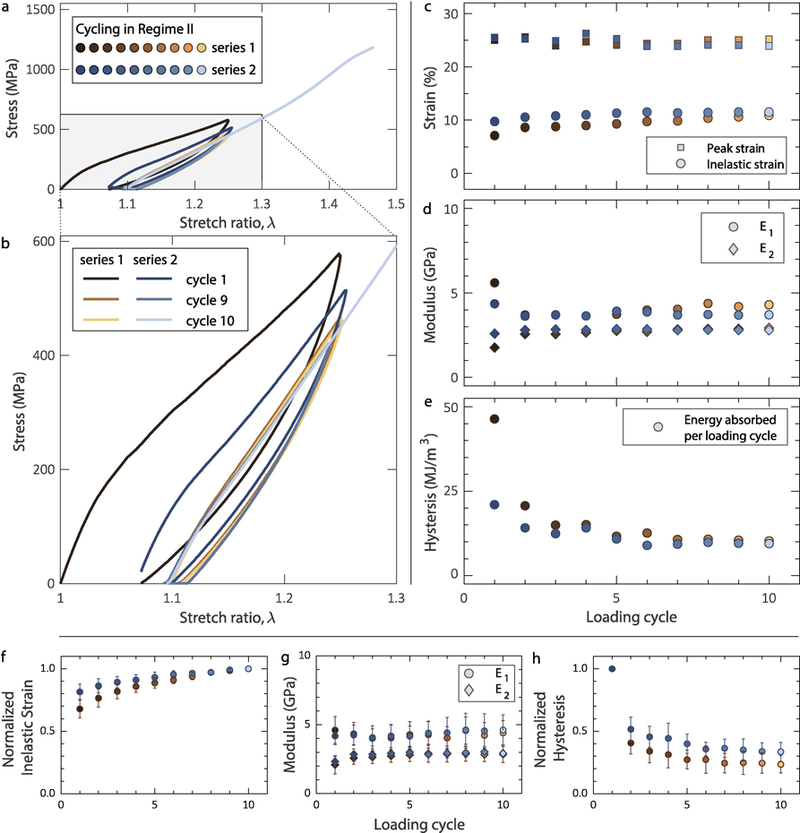
Figure 4.

a,b. Collagen fibrils cycled within regime II demonstrated steady-state hysteresis. c. Inelastic strain showing a steady-state response after the first two cycles during cycling before (brown symbols) and after (blue symbols) a 60-min relaxation interval. d. Elastic modulus in regime I (E1) and regime II (E2) showing insensitivity to mechanical cycling. e. Energy dissipated per loading cycle showing a steady-state before and after 60 min relaxation. For the data shown, the fibril diameter was 157 nm. Mean value of f. inelastic strain, g. elastic moduli E1 and E2, and h. hysteresis vs. cycle before and after recovery for all (8) cyclic tests conducted in regime II. The inelastic strain was normalized with the steady-state value in the 10th cycle, while the hysteresis was normalized with the value of the first cycle. Statistical data for inelastic strain and hysteresis are presented in normalized form because their absolute values depend on the applied λmax (see later Figure 6a). The error bars correspond to one standard deviation.
