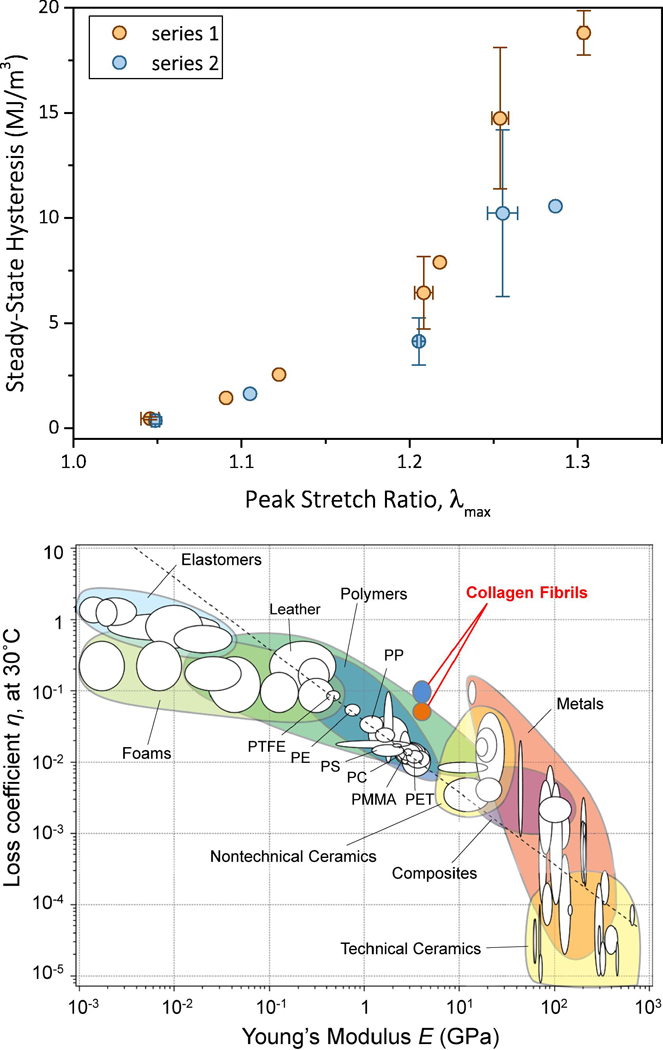
Figure 6.

a. Steady-state hysteresis vs. λmax in the entire range of applied λmax before (series 1) and after (series 2) recovery. When available, the data points are the averages of two or more tests, while the error bars are equal to one standard deviation. b. Loss coefficient vs. elastic modulus for the entire range of homogeneous materials. Reconstituted mammalian collagen fibrils demonstrated a loss coefficient that was an order of magnitude higher than any material within their modulus range, thus expanding the envelope of material loss behavior. Orange bubble corresponds to the loss factor of steady-state response and cyan bubble corresponds to the loss factor of the first cycles of series 1 and 2. Chart adapted from [32] and modified to include the loss coefficients calculated based on the present results.
