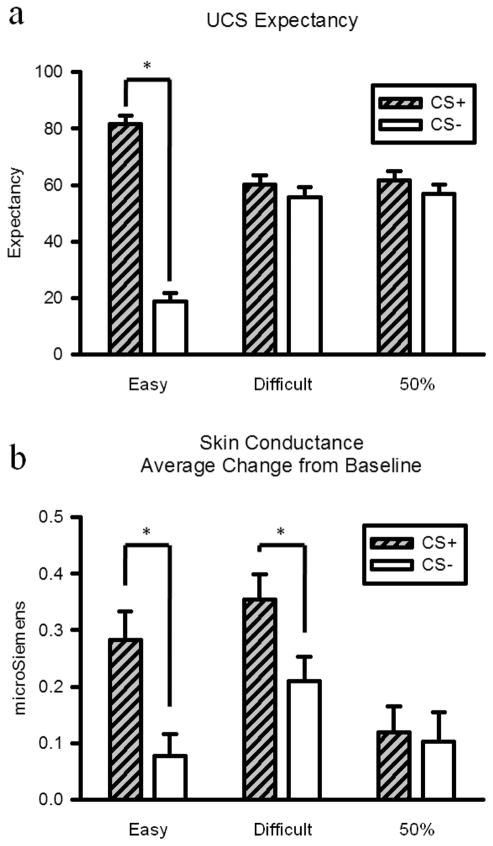
Figure 2.
(a) Unconditional stimulus (UCS) expectancy data for conditional stimuli (CS) CS+ and CS− trials for each group. The CS+ trials depicted for the 50% group were the trials that were paired with the UCS, whereas the CS− trials were trials in which the UCS was not presented. (b) Skin conductance response for CS+ and CS− trials for each group. Error bars show SEM. Asterisks depict significant differences at p < .05.

