
FIGURE 7.
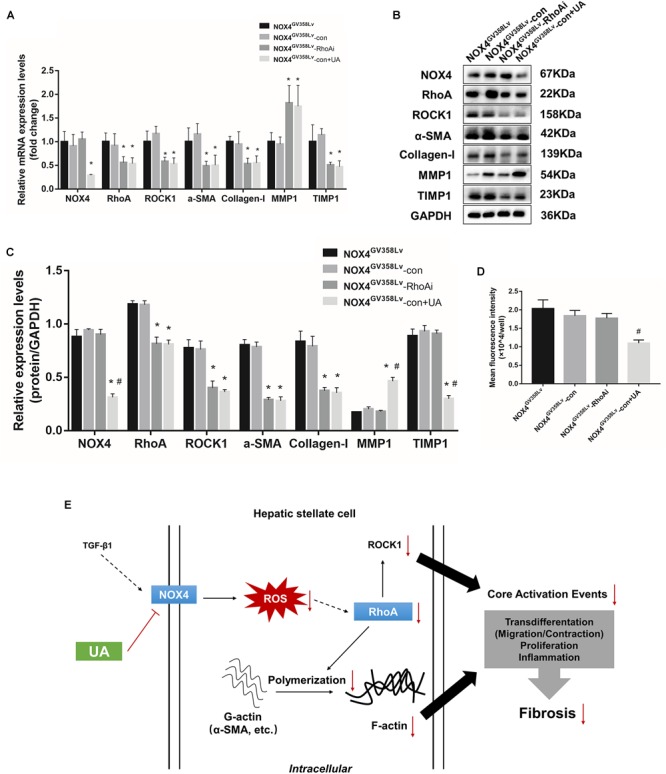
mRNA and protein expression changes in the NOX4GV 358Lv-RhoA shRNA stable cell line and direct binding analysis of NOX4 and RhoA. (A) RT-qPCR analysis of the mRNA expression levels in each group. (B,C) WB analysis of the protein expression levels in each group. (D) ROS contents in each group detected by the DCFH-DA assay. The data are presented as the means ± SEMs of three replicates. ∗p < 0.05, versus the CON group; #p < 0.05, versus the NOX4GV 358Lv group. (E) Recapitulative overview scheme of the study.