
FIGURE 5.
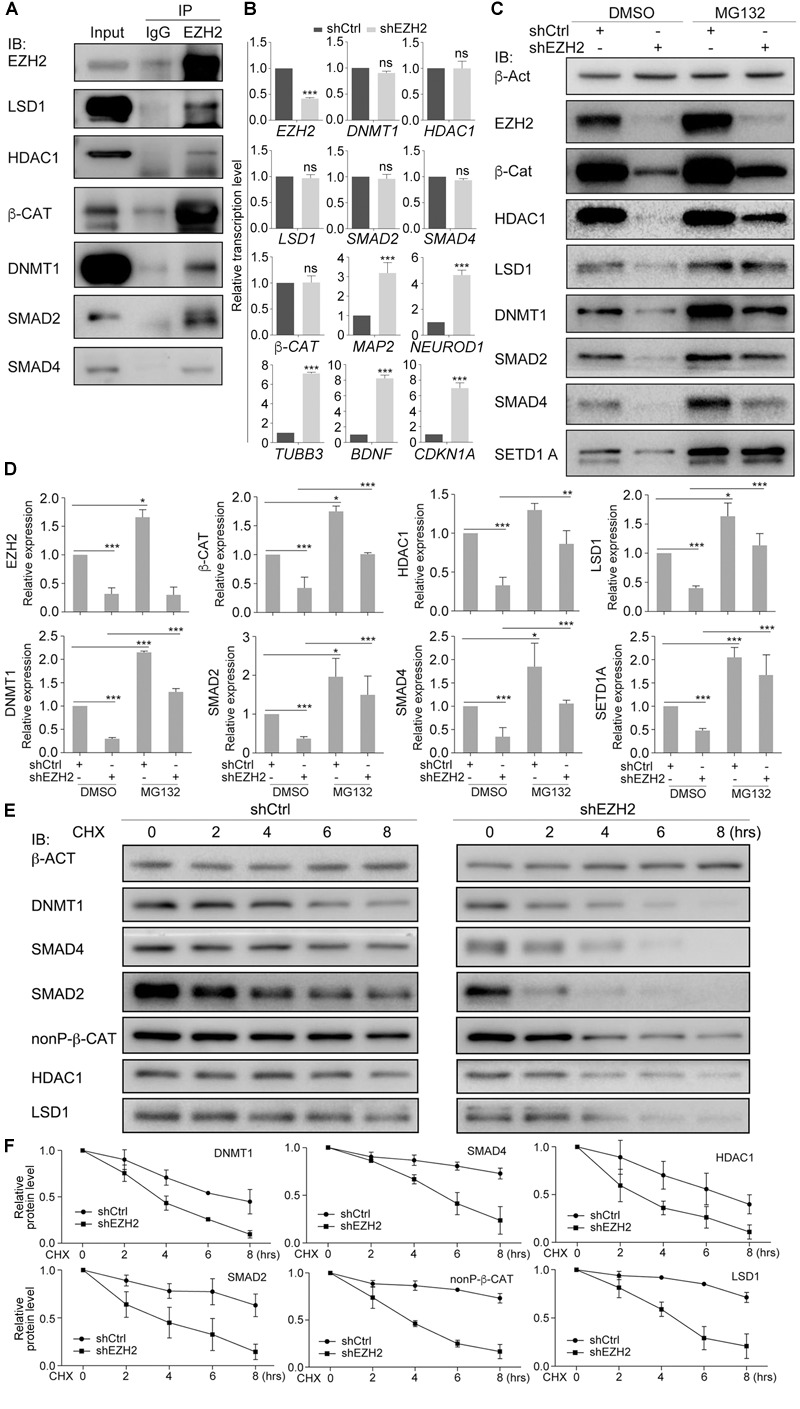
EZH2 interacts with and regulates stability of LSD1, HDAC1, DNMT1, SMAD2/4, and β-CAT in SW480 cells. (A) Co-IP shows interactions between EZH2 and other proteins. Co-IP with an IgG antibody was performed in parallel as a negative control, and cellular protein level was used as positive control (Input). (B) Regulatory effect of EZH2 knockdown (shEZH2) on gene expression detected with qRT-PCR. Significance in gene expression change was calculated for experiments in triplicate using Student’s t-test. Data are shown as mean ± SEM. ns, not significant. ∗∗∗p < 0.001. (C) Effect of EZH2 knockdown on protein level in cells in the absence (DMSO) or presence (MG132) of MG132. (D) Quantification of protein levels in (C), significance was calculated for experiments in triplicate using Student’s t-test. Quantification is shown as mean ± SEM. ∗p < 0.05, ∗∗p < 0.01, ∗∗∗p < 0.001. (E) Analysis of the effect of EZH2 knockdown on protein half-lives by treating HEK293T cells with CHX in a time series. (F) Quantification of relative protein levels in triplicate experiments in (E), shown as mean ± SEM.