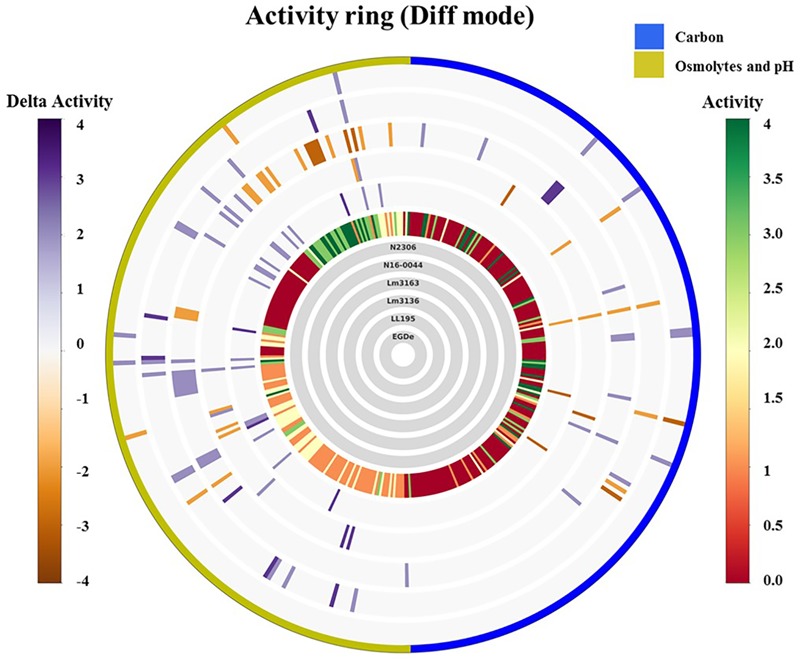
FIGURE 1.

Overall growth/metabolic activity ring based on phenotype microarray comparison of the strains with respect to C-source utilization (PM01 and PM02) and stress (osmolytes and pH; PM09 and PM10) resistance: gray inner circles indicate the strains’ order; external circle indicates the PM categories. The activity index (AV) calculated for each strain and well is reported as color stripes going from red (AV = 0) to green (AV = 4). Delta activity: the difference with the AV value of the reference strain is reported when equal to or higher than 2 AV; gray is no difference; purple indicates a higher activity; orange color indicates a lower activity.
