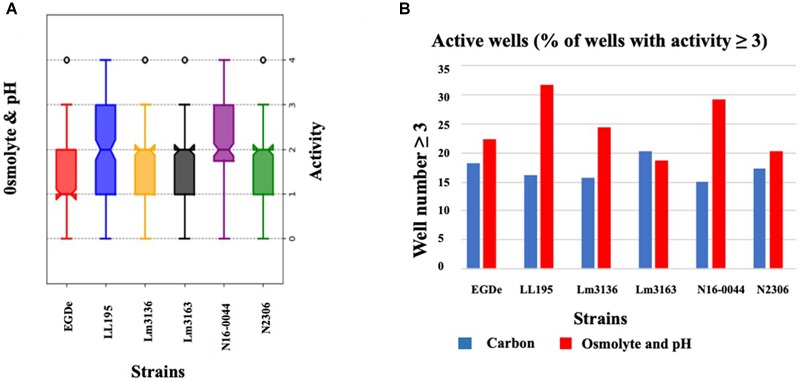
FIGURE 2.

Variation of C-source utilization and stress tolerance profiles among L. monocytogenes strains. (A) Box-plot showing growth/metabolic activities observed among the study strains under pH and osmotic stress conditions. (B) Bar graph displaying the percentage of compounds under which each strain had an activity that equaled or was above 3 AV.
