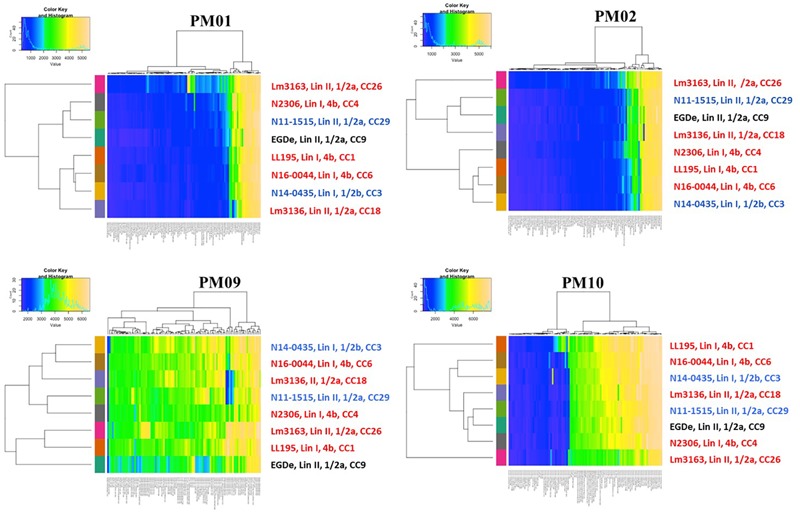
FIGURE 3.

Heatmaps showing clustering of the strains based on PM01, PM02, PM09, and PM10 growth/metabolic activity results. Clinical listeriosis outbreak strains are shown in red, strains isolated from food during routine check are shown in blue and the L. monocytogenes EGDe reference strain is shown in black. Each of the colored bars identified on the x-axis represents the different PM test conditions applied and for detailed information on the reactions see Supplementary Figures S2A–D.
