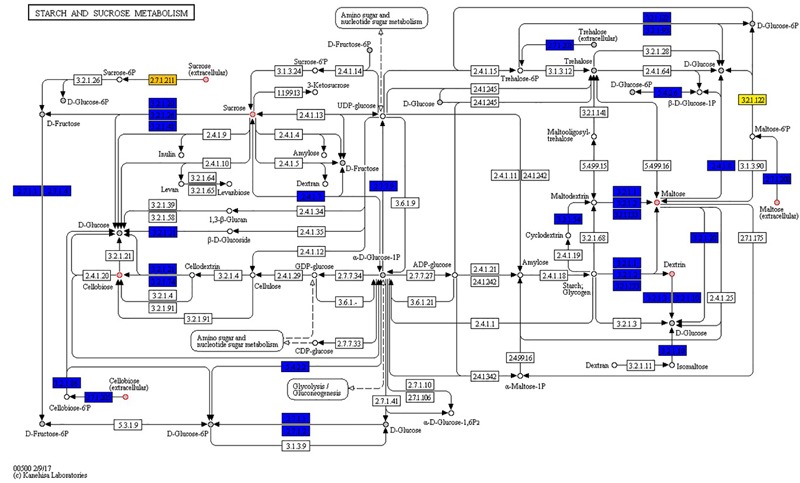
FIGURE 7.

Strains show high phenotypic variability despite high genomic and metabolic pathway conservations. Starch and sucrose metabolism map: boxes represent reactions while circles represent compounds. Core reactions are colored blue, variable reactions are colored orange or yellow; compounds present in PM plates are filled with gray. Red circles around compounds highlight those compounds for which at least one strain has an AV difference with another strain equal or higher than 2 AV.
