FIGURE 3.
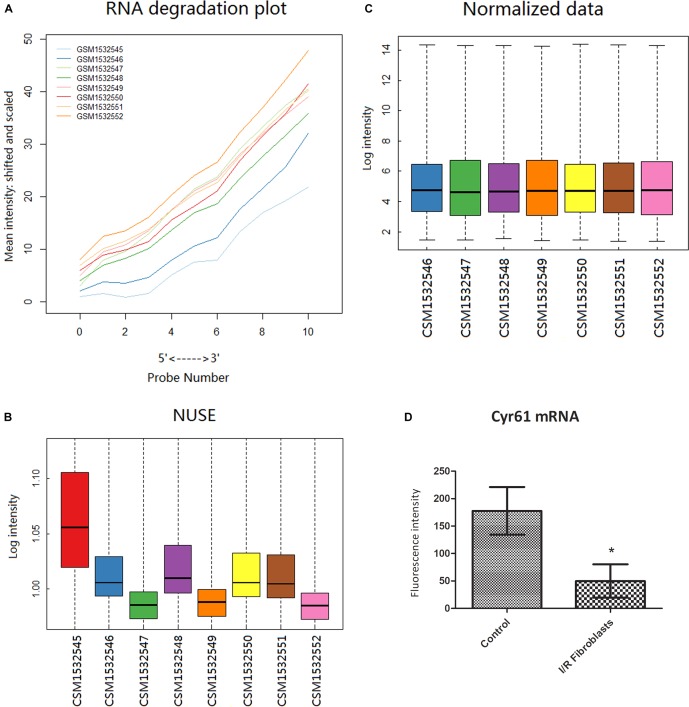
Cyr61 was low expressed in renal fibroblasts at 3 days after IR. Bioinformatics was used to preprocess the GSE62732 gene chip data and calculate the difference of Cyr61 expression. The RNA degradation curve (A) and NUSE box plot (B) were used to screen unqualified samples (the slope of the RNA degradation curve is significantly larger or the NUSE value is more than 1.05). (C) RMA standardization was used for subsequent analysis. (D) The expressions of Cyr61 gene in control and IR fibroblasts. ∗P < 0.05.

