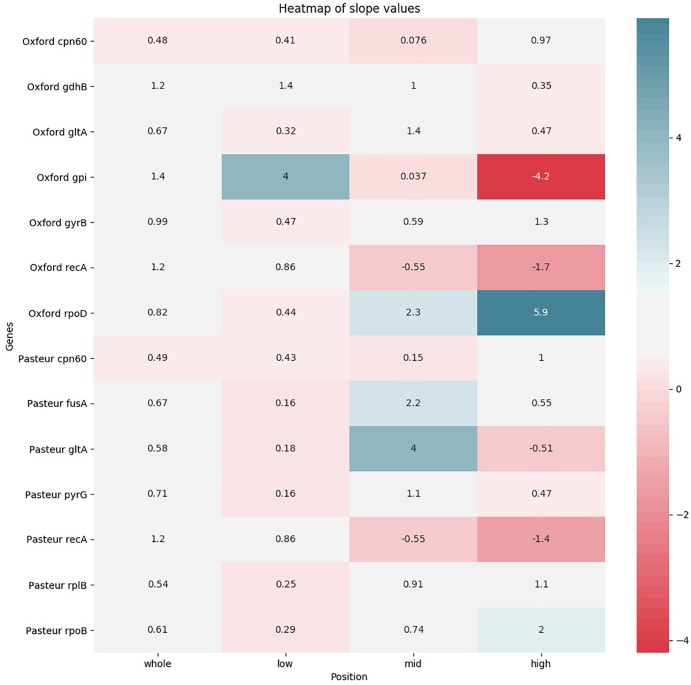
FIGURE 6.
Heatmap showing the levels of agreement of each MLST locus to a reference alignment based on the core genome. Agreement levels are shown in terms of regression line slopes obtained from distance values between genome pairs. For each locus four regression were obtained, based, respectively, on the entirety of genome-wide distances and three subranges. White color indicates that a MLST locus represents the genome-wide distances well, showing a similar evolutionary pace. Red shades (indicating a negative correlation) and blue shades (indicating that the MLST locus shows an evolutionary pace much higher than the genome wide distances) indicate that the locus variation does not well represent genome variation.

