. 2019 Apr 2;10(18):4839–4846. doi: 10.1039/c9sc00815b

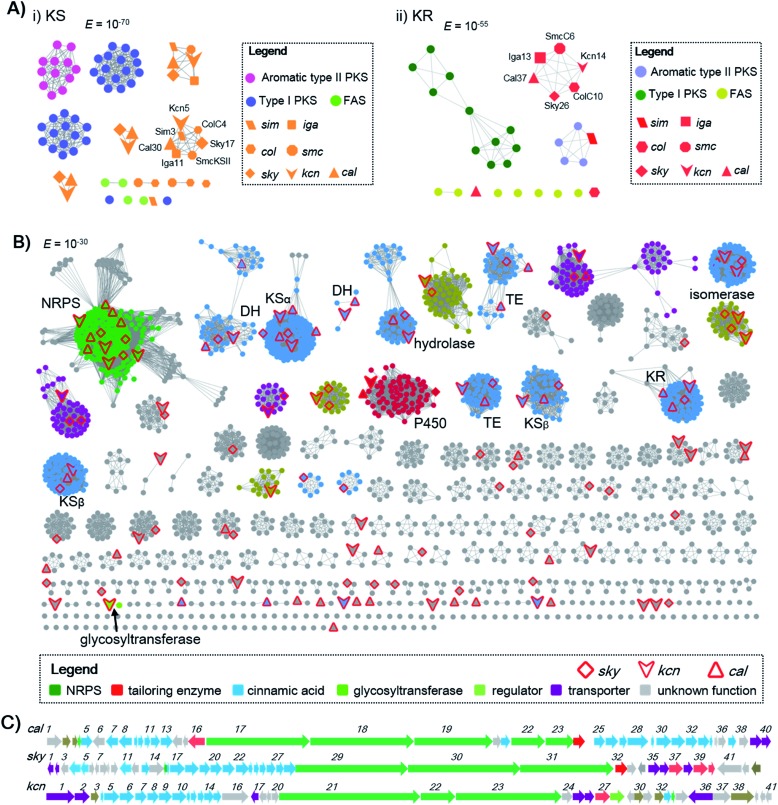
Scheme 1. Genome mining of CCNPs. (A) The SSN analysis of representative KSs and KRs. (i) KSs are displayed at an E value threshold of 10–70. KS proteins (Sim3, Cal30, Iga11, SmcKSII, Sky17 and ColC4) from polyene type II PKSs are clustered together; (ii) KRs are displayed at an E value threshold of 10–55. KR proteins (SimJ2, Cal37, Iga13, SmcC6, Sky26 and ColC10) from polyene type II PKSs are clustered together. (B) The GNN for CCNPs consisting of two known (sky and cal clusters) and 51 newly identified CCNP clusters. The GNN is displayed at an E value threshold of 10–30. (C) BGCs for WS9326 (cal), skyllamycin (sky) and kitacinnamycin (kcn). The GNN and BGCs are color-coded based on the proposed function.

Scheme 1