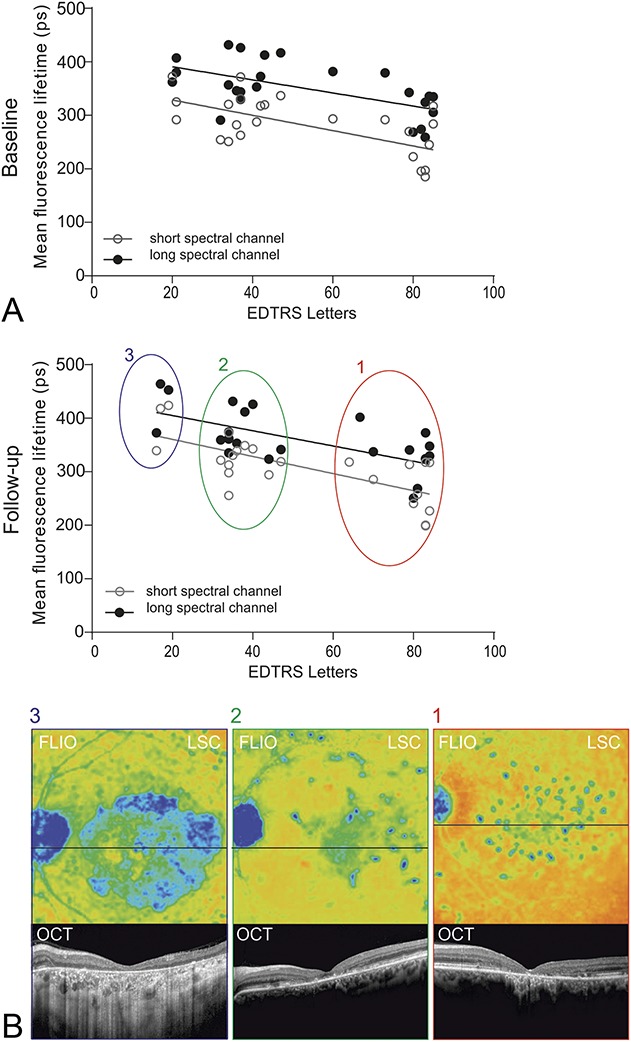
Fig. 1.

Correlation of BCVA (ETDRS letters) with mean fluorescence lifetime (ps) within the central ETDRS subfield of the short (white circle, SSC, 498–560 nm) and the long (black circle, LSC) spectral channels at (A) baseline (SSC: r2 = 0.35, P = 0.002; LSC: r2 = 0.32, P = 0.004) and (B) follow-up (SSC: r2 = 0.51, P < 0.0001; LSC: r2 = 0.45, P = 0.0001). Representative fluorescence lifetime (FLIO, LSC) images of three identified groups and correlating OCT scan of the indicated lines in the FLIO images are shown below.
