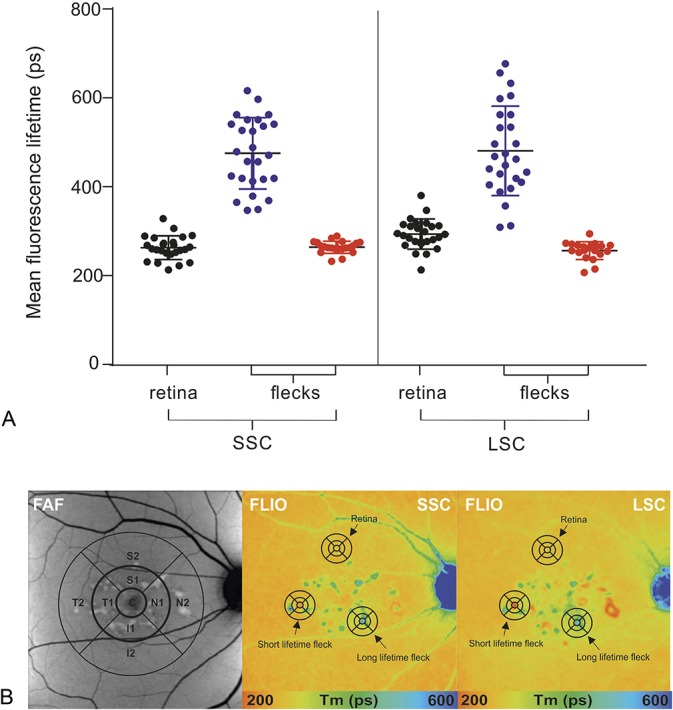
Fig. 2.

A. Quantitative analysis of mean retinal autofluorescence lifetime values in the SSC and LSC in patients with STGD. Following areas were analyzed: surrounding retinal tissue ( ), flecks with long (
 ) and short (
 ) fluorescence lifetimes. B. A small region of interest (circle diameter: 0.16 mm) was used to investigate mean retinal autofluorescence lifetimes within short lifetime flecks, long lifetime flecks, and the surrounding retina. Areas of interest represent a mean value of three individual measurement locations. Fluorescence lifetime data of both spectral channels were analyzed separately.
